
Diversity, Democracy and Politics Along Many Lines
Evidence from Paired Comparisons in the PODS Data Set
This report examines majority–minority dynamics and ethnic, racial and religious cleavages in six countries—Brazil, Colombia, India, Senegal, Sierra Leone and the United States. Based on a unique survey of public perceptions of democracy, the report points to several key findings.
First, pluralism and diversity are not inherently divisive but can become so under certain social conditions, particularly when elites have incentives to foster them and political and democratic institutions lack the strength to constrain or counteract such forces. Second, dissatisfaction with existing democratic institutions, which is frequently more prevalent among minority respondents, is neither the same as nor indicative of dissatisfaction with democracy itself. Third, data disaggregated by social groups are key to identifying inequalities and institutional failures, as well as for designing policies that can address them.
The survey findings show that Sierra Leone exhibits deep ethnic polarization, particularly between the Mende and the Temne groups, which in turn is correlated with perceptions of electoral credibility, government performance and access to justice. These divisions reflect entrenched ethno-political alignments and the legacy of civil conflict and are preserved through ethno-patrimonial networks that tie electoral victory to the provision of state goods. In contrast, Senegal—despite similar ethnic diversity—shows minimal political divisions along ethnic lines, attributed to a history of deliberate civic identity building. While both countries share low confidence in the capability of their respective judicial systems to deliver justice, Senegal’s political cleavages are shaped more by geography and socio-economic inequality than ethnicity.
In Brazil, the most prominent social cleavage observed is religious: Protestant respondents expressed significantly more scepticism about electoral credibility and government performance than Catholics and non-religious groups. However, the fact that Evangelical Protestants are a major source of support for former President Jair Bolsonaro likely reflects partisan alignment more so than religious division. Racial divisions, while present in broader societal structures, did not manifest strongly in perceptions of democracy. In contrast, Colombia displayed more uniform pessimism across social groups, with minimal variation by race or religion. Instead, the legacy of armed conflict and displacement and accompanying economic inequality appears to be the dominant cleavage, particularly affecting low-income respondents, who consistently expressed more negative views on justice, economic progress and democratic institutions.
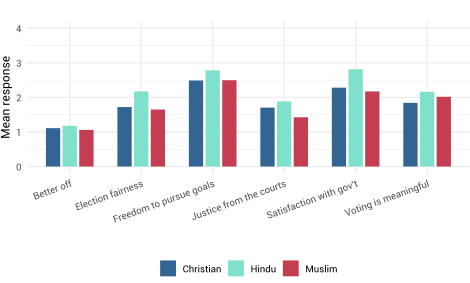
In India, Hindu respondents expressed significantly more confidence in electoral credibility, access to justice and government performance than Christian and Muslim minorities. These differences reflect the country’s political climate under the Bharatiya Janata Party, whose strong rhetorical emphasis on India’s Hindu identity, often reflected in policies, has been perceived as exclusionary by some members of minority groups. In the USA, racial and religious cleavages were less pronounced than initially expected, with minimal variation in perceptions of electoral credibility and access to justice across racial groups. However, significant divides emerged along geographic and partisan lines: rural and Protestant respondents—groups more likely to support Donald Trump—expressed greater scepticism about democratic institutions and economic progress than urban and non-religious respondents. These findings suggest that, while India’s cleavages are rooted in religious identity and perceived institutional exclusion, the USA’s divisions are more shaped by political polarization and elite-driven narratives.
Building sustainable democracies requires inclusive reforms and institutions that enjoy widespread support among all citizens, not only dominant social groups. Disaggregated demographic data, as demonstrated in this report, are essential for identifying and addressing inequalities in service provision, democratic representation and perceptions of democratic systems’ capabilities. The key to ensuring resilient democracies is to act proactively to make sure that institutions are working for all citizens, not to wait until the situation becomes critical, as democratic backsliding is easier to prevent than to reverse.
This report is the latest in the Perceptions of Democracy Survey (PODS) series and, like its predecessors, is based on a unique poll of popular attitudes towards democracy and democratic institutions in a diverse set of countries from around the world. Previous reports have found that self-identified members of majority and minority groups perceive themselves as receiving differential, and at times unfair or unjust, treatment in even the highest-performing democracies (International IDEA 2024b). While those reports established that a popular demand for democracy remains strong across borders and between social groups, democracy as it currently exists does not always work for all.
A core finding of the PODS series is that self-identified minorities tend to perceive more obstacles to accessing democratic institutions and are generally more doubtful about these institutions’ performance than members of majority groups (International IDEA 2024b; Runey 2024). This finding is corroborated by academic research (Martin and Blinder 2021; Simonsen 2021; Kuk, Hajnal and Lajevardi 2022). However, a complicating factor in earlier reports that this one seeks to address is that self-identified minorities tend to overlap less with census-defined minority groups than one would commonly expect. For example, nearly two thirds of Black respondents in the United States did not identify themselves as a minority, while 15 per cent of white respondents did. About one third of respondents from Sierra Leone’s two main ethnic groups, the Mende and the Temne, identified as minorities. Although they account for less than 15 per cent of the population, only half of Muslim Indians self-identified as minorities. This mismatch between self-perception as a minority and being a member of a census-defined minority group is the reason why this report expands the lens to look beyond majority–minority dynamics to encompass a broader range of demographic patterns, focusing on key social cleavages in six countries—Brazil, Colombia, India, Senegal, Sierra Leone and the USA. Instead of self-identified minority status, the report instead disaggregates the data by religion, race and ethnicity.
In some countries, cleavages along these lines are acute and well documented, such as Sierra Leone’s division of politics along a north–south, Temne–Mende ethnic axis. In similarly multiethnic Senegal, however, ethnicity is largely politically inconspicuous but may still play a role in how the country’s democratic institutions are perceived. In other countries, the political relevance of these ethnic and religious divisions is itself contested. Brazil, for example, is sometimes heralded as a ‘racial democracy’, where white, Black and racially mixed Brazilians enjoy equal access and influence, while also being a country where real systemic and structural violence disproportionately affects the country’s non-white population (Schwartzman 2020). Neighbouring Colombia has a similar demographic make-up, and racial profiling and discrimination are persistent problems. However, the country’s violent 20th century may indicate that other cleavages such as geography, poverty and gender may be more salient (Uprimny 2011; Ikawa 2017; Laurent 2018).
Similarly, race has historically been an axis on which politics in the USA has turned, and the persistence of Jim Crow laws continue to profoundly affect the everyday lives of Blacks and other racial and ethnic minorities (Coates 2014). That American politics turns on questions of race and ethnicity does not necessarily mean that Americans are divided along racial or ethnic lines, and this report will also examine alternative social cleavages. In India—like the USA, a vast, diverse federal democracy—the primary cleavage is not race or ethnicity but religion. Similarly, this is not to say that Indians are divided strictly along religious lines; rather, they are divided between competing visions of a dominant civic or Hindu nationalist identity (Vaishnav 2024).1
Any discussion of this nature must begin with data. This report is based on nationally representative public opinion surveys conducted as part of the PODS project. Table I.1 presents the analysed countries’ racial/ethnic and religious make-up, democratic institutions and performance as outlined in the latest Global State of Democracy (GSoD) Indices.
| Race/Ethnicity | Religion | Political system | GSoD Indices | |
|---|---|---|---|---|
| Brazil | Mixed: 45.3% White: 43.5% Black: 10.2% Indigenous 0.6%* Asian: 0.4%* | Catholic: 52.8% Protestant: 26.7% Candomblé/ Umbanda: 1.8% None: 13.6% | Presidential system, list proportional representation | Representation: 0.72 Rights: 0.56 Rule of Law: 0.56 Participation: 0.87 |
| Colombia | Mestizo/white: 87.6% Black: 6.8% Indigenous 4.3% | Catholic: 63.6% Protestant: 17.2% | Presidential system, list proportional representation | Representation: 0.65 Rights: 0.48 Rule of Law: 0.51 Participation: 0.55 |
| India | Indo-Aryan: 72.0%** Dravidian: 25.0%** Other: 3.0%** | Hindu: 79.8% Muslim: 14.2% Christian: 2.3% Sikh: 1.7% Other: 2.0% | Parliamentary system, first past the post | Representation: 0.58 Rights: 0.39 Rule of Law: 0.50 Participation: 0.50 |
| Senegal | Wolof: 39.7% Pulaar: 27.5% Sereer: 16.0% Mandinka: 4.9% Jola: 4.2% Soninke: 2.4% Other: 5.4% | Muslim: 97.2%** Christian: 2.7%** | Presidential system, parallel | Representation: 0.59 Rights: 0.51 Rule of Law: 0.52 Participation: 0.75 |
| Sierra Leone | Temne: 35.4% Mende: 30.8% Limba: 8.8% Kono: 4.3% Korankoh: 4.0% Fullah: 3.8% Mandingo: 2.8% Loko: 2.0% Sherbro: 1.9% Krio: 1.2% Other 5.0% | Muslim: 77.1% Christian: 22.9% | Presidential system, first past the post | Representation: 0.46 Rights: 0.54 Rule of Law: 0.46 Participation: 0.67 |
| USA | White: 61.6% Black: 12.4% Asian: 6.0% Indigenous: 1.1% Other: 8.4% Two or more: 10.2% | Protestant: 46.5% Catholic: 20.8% Jewish: 1.9%* Mormon: 1.6%* Other Christian: 1.7%* Muslim: 0.9%* Buddhist: 0.7% Hindu: 0.7% Other: 1.8% No affiliation: 22.8% | Constitutional federal republic, first past the post | Representation: 0.70 Rights: 0.72 Rule of Law: 0.71 Participation: 0.85 |
Each of the following three chapters discusses the same set of survey questions for two countries that share some historical, institutional or social features. Chapter 1 discusses Senegal and Sierra Leone, two postcolonial and multiethnic West African countries. Chapter 2 covers India and the USA—federal democracies with large populations and strong right-wing parties. Finally, Chapter 3 discusses Brazil and Colombia, two multiracial Latin American democracies that share a border.
What makes a social cleavage?
Throughout the analysis, terms such as race, ethnicity, religion and economic class are used with full knowledge that these are not discrete categories in any country discussed herein. Ethnicity and race are, of course, not interchangeable terms. In this report, ethnic identity is used in reference to countries where it is the primary social group identity (Senegal and Sierra Leone, for example). In countries where race is more salient, this method of social group identification is used instead (Brazil, Colombia and the USA). In all cases, race, ethnicity and religious identity were self-reported by respondents.
While they are not the core focus of this report, other social cleavages—between rural and urban respondents, between men and women, and between the poorest in a society and the rest—are discussed whenever relevant and where statistically significant cleavages exist. This expanded analytical lens will allow us to ask whether a social cleavage visible in the data is unique or part of a broader social division. It also may tell us where social class or geography plays a larger role in national politics than ethnic or religious identity. As class is a social construct that can be made and unmade, this comparison may help us to understand where urbanization, gender dynamics or patterns of migration may lead older social challenges to give way to new ones (Bourdieu 1987).
It is necessary to stress that these categories are often porous and overlapping. Race, ethnicity and social class should not be thought of in mutually exclusive or competing terms but as complementary ways of describing how individuals are grouped in a social hierarchy. In the words of Stuart Hall (1978), ‘race is the modality in which class is lived’. Hall was describing British and American postcolonial contexts, but his underlying principle—that, for an individual in a society, racial, ethnic, religious or other group identities are not separate from but are an expression of economic class—holds true. Human diversity—racial, ethnic, religious or otherwise—is not in and of itself a divisive force (Harell and Stolle 2010). As this report demonstrates, diversity is one of many axes along which material social hierarchies are experienced, and on which elite contestation takes place.
Methodology
The PODS data set includes survey data from 19 countries, 6 of which are discussed in this report. Two survey firms collected data between mid-2023 and early 2024 (please see Annex B for specific dates for each country). In countries with a high level of Internet penetration and where online panels deliver valid results, International IDEA contracted YouGov to run the survey. In countries where this method is not effective, GeoPoll was contracted to run the survey through telephone-based interviews.
In each country, the survey research providers contacted a representative sample of the population (approximately 1,000 people) and an additional sample of people whose household income indicated that they were experiencing poverty (approximately 500 people).3 This oversampling of the poorest and most marginalized people allows us to have confidence in our assessment of how these diverse groups of people differ from the rest of the population. For the analysis, the representative sample and the oversample were pooled, and each respondent was weighted so that the reported frequencies are not unduly influenced by imbalances in the sample. In the figures and discussion presented in this report, the weighted proportion of respondents who gave a particular answer to a question is always reported.
Respondents also provided their race or ethnicity and religion based on a census or other equivalent official or authoritative data. Respondents also had the option to add their own preferred category, and International IDEA reviewed, cleaned and standardized this data. Only social groups with at least 50 respondents are discussed in this report. Unless otherwise indicated, the PODS data set is the source of all the figures in the report.
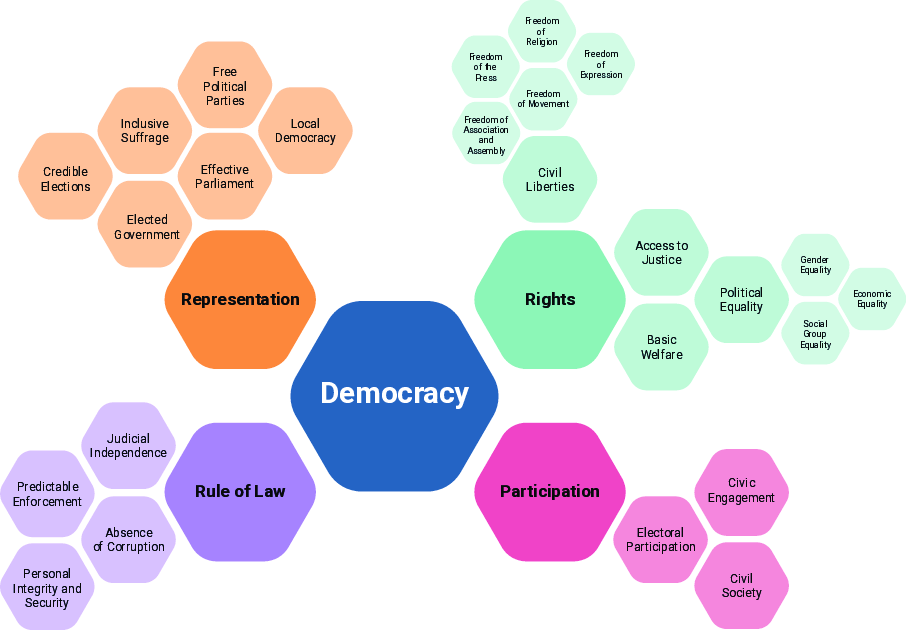
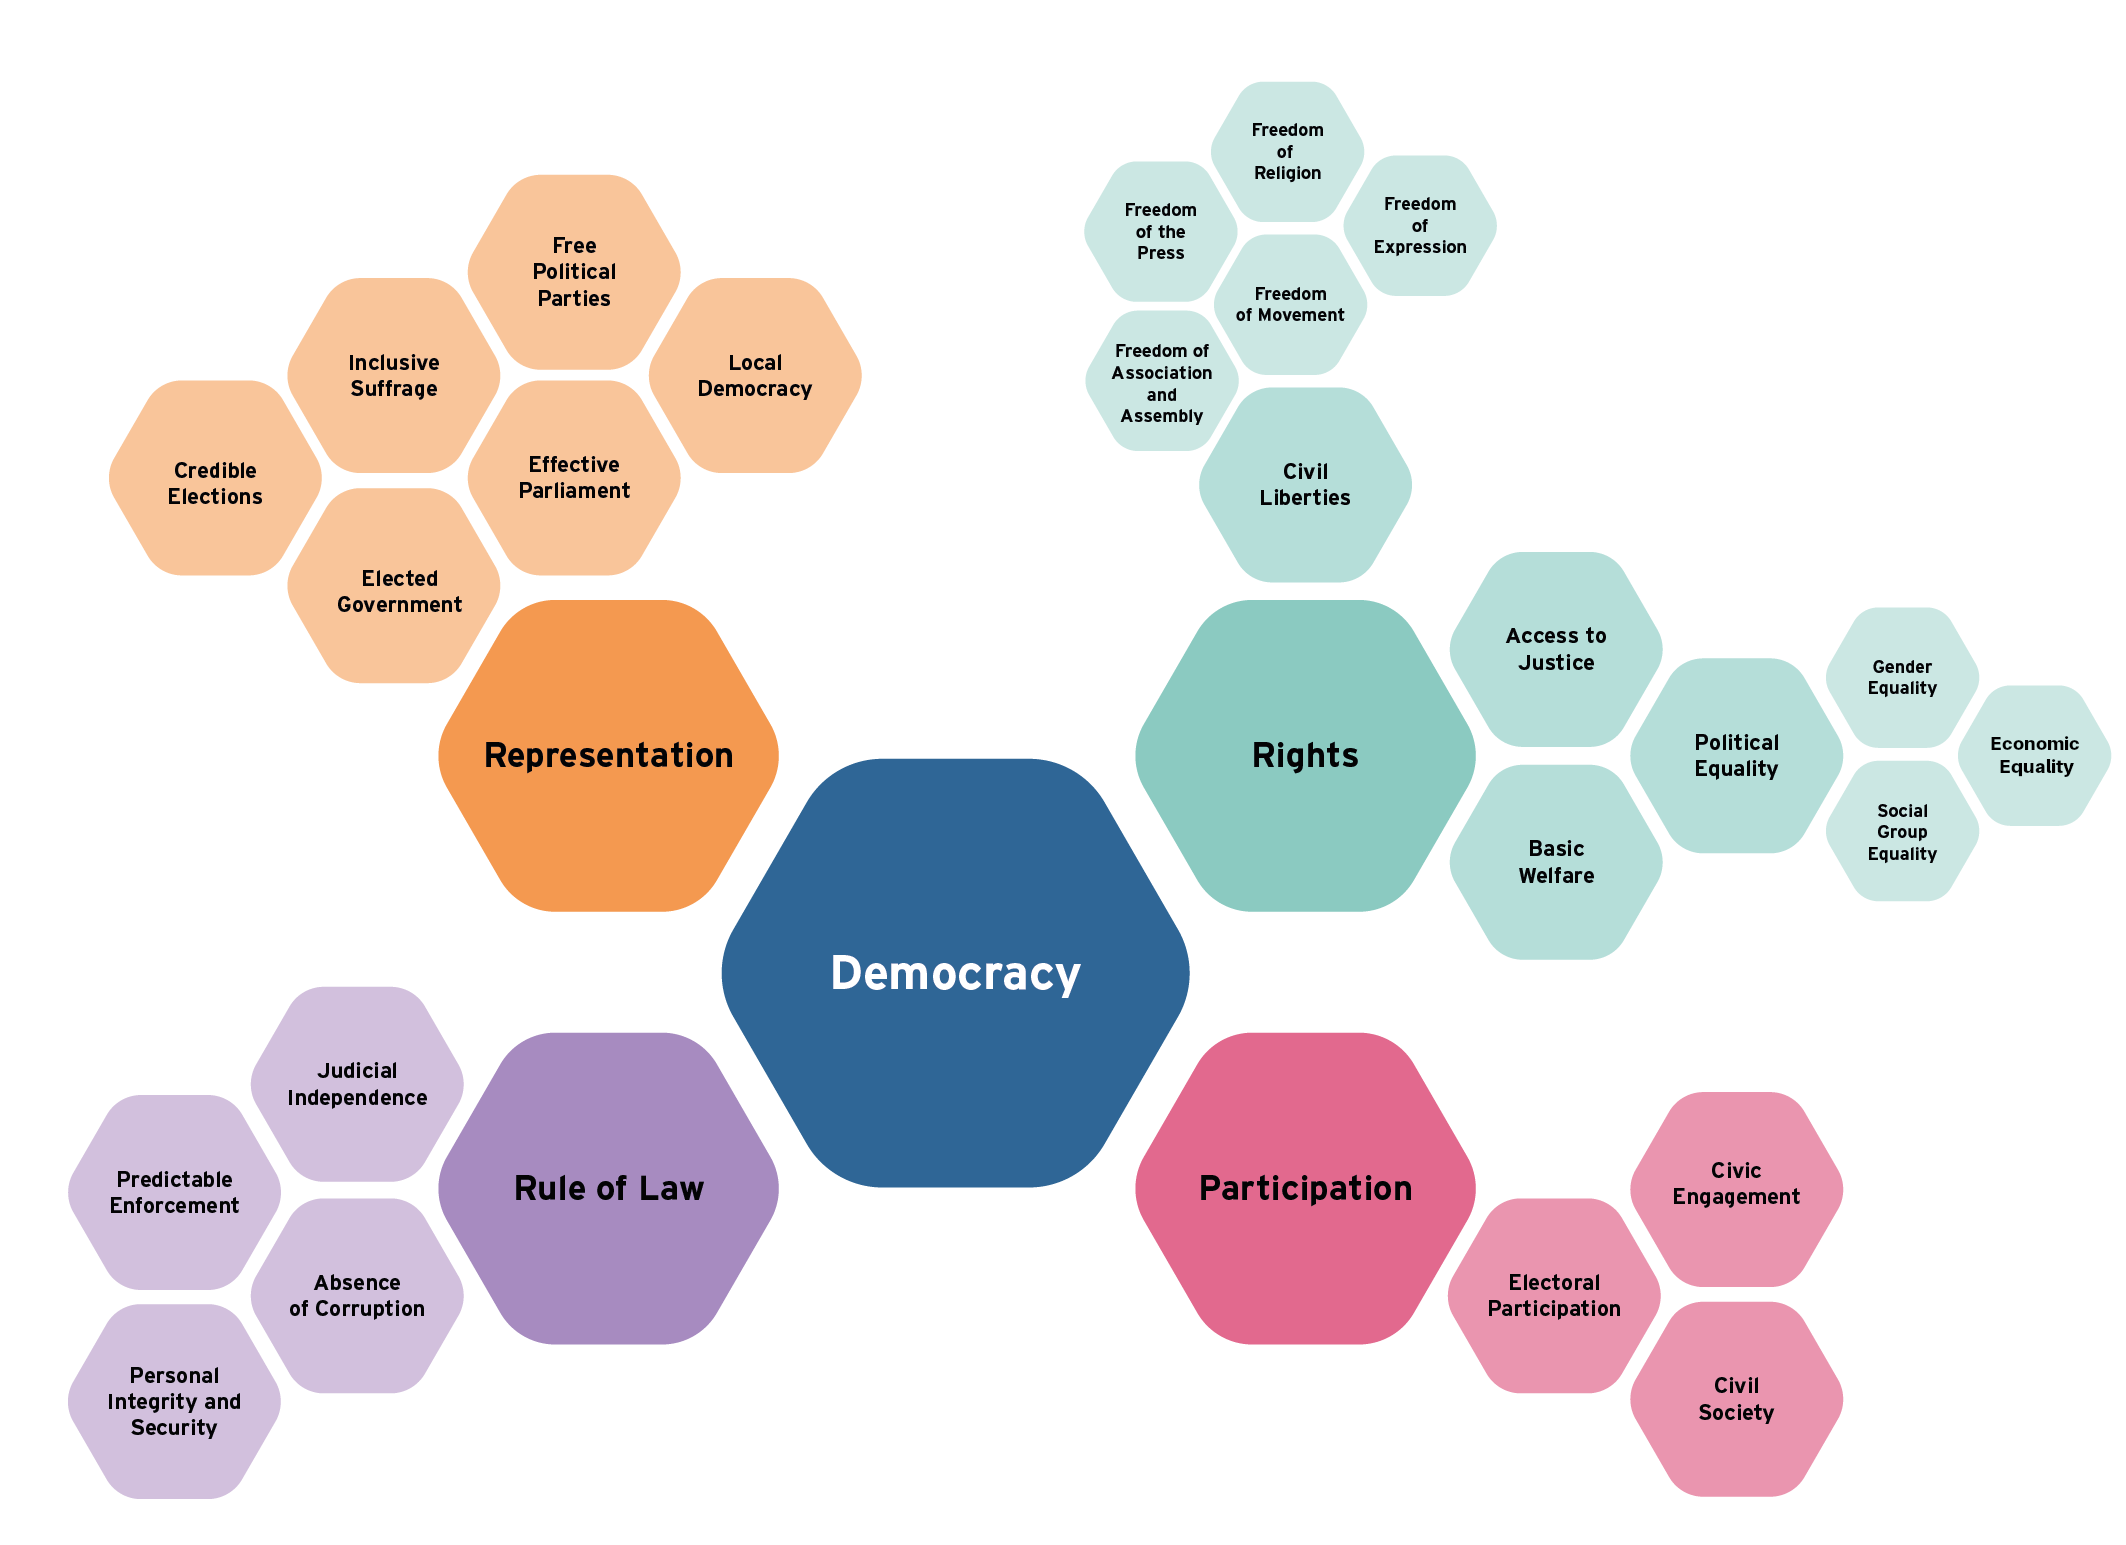
The GSoD Indices are a quantitative data set that measures national performance across discrete areas of democracy, in which democracy is understood as a system in which there is public oversight of decision making and decision makers, and in which there is equality in the exercise of that oversight. The complete data set covers the years 1975–2024 (International IDEA n.d.a). The Indices employ a hierarchical conceptual framework oriented around four core categories of democratic performance—Representation, Rights, Rule of Law and Participation (see Figure I.1). Each category is subdivided into factors (such as Credible Elections or Judicial Independence) and subfactors (such as Freedom of Expression or Social Group Equality) (International IDEA 2025g).
Questions for analysis
Table I.2 lists the questions from PODS which are analysed in each of the three chapters of this report. The numbers accompanying each response option are those used to calculate mean scores and carry out other statistical analysis of response patterns. As not all questions had the same number of response options, scales differ slightly between questions.
| Questions | Responses |
|---|---|
| Taking into account election day, the election campaign and the vote-counting process, would you consider the most recent national election in [COUNTRY] to have been free and fair? | <0> No, not at all <1> Not really <2> It’s complicated <3> Yes, somewhat <4> Yes |
| Do you agree or disagree with the following statement? Voting is a meaningful way of impacting the government. | <0> Strongly disagree <1> Somewhat disagree <2> Neither agree nor disagree <3> Somewhat agree <4> Strongly agree |
| In your experience, does the court system provide equal and fair access to justice? | <0> Never <1> Rarely <2> Sometimes <3> Often <4> Always |
| Do you have the freedom to pursue the goals that matter to you and to build the kind of life that you want for yourself? | <0> Never <1> Rarely <2> About half of the time <3> Usually <4> Always |
| Comparing your personal economic conditions with those of your parents when they were about your age, would you say that you are better off, worse off or about the same? | <0> Worse off <1> About the same <2> Better off |
| How satisfied are you with the overall performance of the national government in your country? | <0> Completely dissatisfied <1> Dissatisfied <2> Neither satisfied nor dissatisfied <3> Satisfied <4> Completely satisfied |
Artwork: Naledi Modupi. All rights reserved.
Key takeaways
- Sierra Leone’s ethno-patrimonial political divides are starkly reflected in assessments of electoral quality, satisfaction with government and economic perceptions, but similarly ethnically diverse Senegal exhibits no such divides.
- Perceptions of the value of voting were much less divided between social groups in Sierra Leone than were perceptions of electoral credibility, with all ethnicities in both countries agreeing that voting is a meaningful way of impacting government.
- Respondents from both countries expressed low confidence in their court systems, with minority groups holding slightly more pessimistic views.
Sierra Leone performs in the mid-range in all four categories of the GSoD framework. It is one of the world’s most ethnically diverse countries. Ethno-regionalism plays a significant role in national politics, with voters typically aligning along tribal and ethnic lines. The country’s two major political parties—the Sierra Leone People’s Party (SLPP) and the All People’s Congress (APC)—have long-standing ties with ethnic groups, with the former linked to the Mende in the south and the latter linked to the Temne and other groups in the north.
The legacy of Sierra Leone’s civil war (1991–2002), which was fuelled by decades of corrupt, autocratic governance and economic mismanagement, saw tens of thousands killed, millions displaced, and widespread atrocities and war crimes. Today, the violence and continuing trauma of the war still influences the contours of governance, public trust in institutions and the shape of the economic recovery. While ethnicity was neither a contributing factor nor a driving force behind the war, the aforementioned ethnic polarization of the country’s politics has likely been driven, in part, by the collapse of a relatively stable Sierra Leonean demos into civil war, as citizens have taken refuge in immediately identifiable subnational ethnic groups. Despite this political polarization, the country is also recognized for its religious diversity and tolerance, with a majority Muslim population and a Christian minority (Drazanova 2019; International IDEA 2025e).
The PODS data set also includes responses from a variety of other smaller ethnic groups in Sierra Leone. In most cases, responses from the Kono and Mandinka ethnic groups align with those of the Temne respondents, and the Fullah, Limba, Loko, Korankoh and Krio respondents align with those of the Mende. These groups are discussed in this report only when there are significant deviations from this general rule.
Senegal also performs in the mid-range in three factors of the GSoD framework and is low-performing in Participation. Political divisions are primarily shaped by social inequities, including in education, and urban–rural divides. Patronage and clientelism also influence electoral dynamics within the country. While the majority of the population is Wolof and Muslim, there is also a significant Christian minority, particularly in the southern region of Casamance, which is culturally and geographically isolated from the rest of Senegal. The southern region has historically been embroiled in low-level conflict, further complicated by separatist movements and a desire for greater autonomy (International IDEA 2025d).
This chapter will focus primarily on ethnic cleavages in these two countries, as well as religious cleavages wherever they may occur.
1.1. Taking into account election day, the election campaign and the vote-counting process, would you consider the most recent national election to have been free and fair?
Responses to this question were assigned numerical values on a five-point scale, with the most negative response being assigned 0; the most positive, 4.4 Therefore, a score above 3 would be quite positive; a score below 2 would indicate a belief that elections were by and large neither free nor fair.
The mean result for Sierra Leone was 2.10. As shown in Figure 1.1, responses are sharply polarized along ethnic lines. Members of the Mende ethnic group (2.67) expressed the highest confidence of any ethnic group in the results of the 2023 general election. Conversely, the Temne (1.60) were far more sceptical.
Electoral observers described the 2023 general election, won by the incumbent SLPP, as well administered but subject to ‘important irregularities and a significant lack of transparency during the tabulation process that severely undermined the credibility of the results’ (The Carter Center 2023). The SLPP is traditionally the party of the Mende, who perceived the credibility of the election to be much higher than did the Temne, who largely support the SLPP’s main rival, the APC. This finding is in line with expectations, as Sierra Leonean politics is often described as ‘ethnoregional–neopatrimonial’, where ethnic groups support political parties in exchange for their financial and political support once they are in power (Kallon 2021).
In other words, democratic politics in Sierra Leone operates as a means of entrenching two polarized ethnic camps in society. As neither camp possesses a significant numerical advantage, the effect is not one of an empowered majority and a dispossessed minority, but one of polarization. Ethnic differences are also not the cause of this polarization—as the counterexample of Senegal will show below—so much as the axis along which polarization takes place.5
Sierra Leone’s score for Credible Elections in International IDEA’s GSoD Indices was 0.50/1.00 for 2023, which is considered mid-range performance. In electoral systems with this level of credibility among the general public, a moderate effect is visible where supporters of the losing candidate are more likely to view the integrity of an election negatively (Mauk 2022). The opposite may also be true: voters who supported the winning candidate in a flawed election may overstate their true evaluation of the electoral process.
In addition to the aforementioned ethnic divisions, there were also divisions along gender lines on this question. For example, Sierra Leonean men (2.24) were more likely to assess the election positively than women (1.95). While notable, all of these divisions are narrower than the Temne–Mende divide.
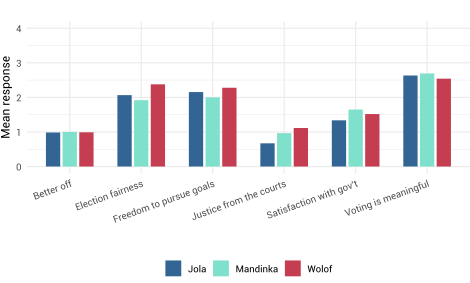
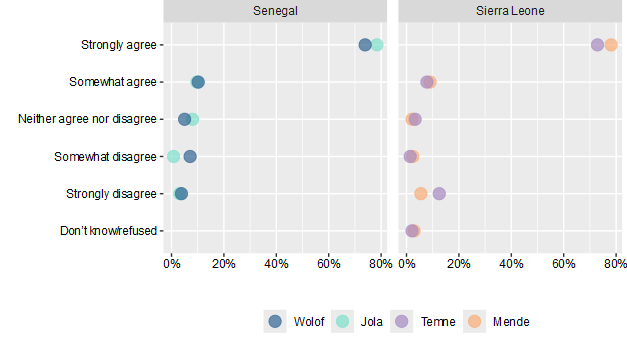
Senegal’s mean score (2.30) was comparable to Sierra Leone’s (2.10). However, Figure 1.2 shows how the country is not as deeply politicized along ethnic and regional lines. The dominant Wolof ethnic group (2.38) expressed slightly higher confidence in the quality of elections than the Jola (2.06) and the Mandinka (1.92) minorities.6 The lack of an ethnic divide in the country is well documented and is frequently attributed to its founding political elites’ conscious efforts to foster a civic Senegalese identity to complement existing ethnic and religious ones (Baleyte et al. 2020).
The country’s ongoing rapid urbanization has produced a more visible political cleavage. Rural voters, who have much more limited access to basic public services and employment than their urban counterparts, are more directly reliant on political patronage in order to meet their basic needs (Baleyte et al. 2020; UN Habitat 2023). A similar economic pattern can be seen in Sierra Leone, but with inverse outcomes for perceptions of electoral credibility.
There is far greater scepticism surrounding the quality of elections among urban Senegalese (1.37) versus their rural (2.32) and town-dwelling (2.49) counterparts. Conversely, in Sierra Leone, urban (2.20), town-dwelling (2.08) and suburban (2.48) respondents have more favourable perceptions of electoral integrity than residents of rural areas (1.75).7
The results from the rural areas illustrate that, while systems of political patronage can degrade overall perceptions of electoral credibility over time, this effect can be unevenly distributed across populations. Patron–client relationships between voters and politicians can be welfare-enhancing for beneficiary groups while undermining welfare provision and government credibility in the aggregate (Keefer and Vlaicu 2008). Over the longer term, entrenched patronage systems may result in a preference for clientelist policies among voters and an understanding that such policies are a normal part of a functioning democracy (Keefer 2007).
1.2. Voting is a meaningful way of impacting the government
For the purposes of this analysis, the responses to this statement were assigned values ranging from 0 to 4, where scores approaching 0 indicate strong disagreement; scores around 2, ambivalence; and scores approaching 4, strong agreement.
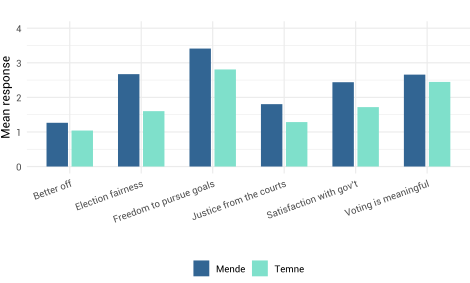
In contrast to the diverging views about electoral credibility, Sierra Leoneans of all ethnicities agree that voting is a meaningful way of impacting the government, with a mean response score of 3.45. Only a small difference—possibly attributable to whether a preferred candidate won or lost—is visible between the Temne (3.31) and the Mende (3.58). These results highlight a key nuance in popular perceptions of elections: Sierra Leoneans perceive their elections as meaningful but only of middling credibility. In this view, the value of elections is not in the exercise of democratic self-governance but in their role in securing patronage from rulers for favoured supporter groups (Mammone 2023).
Senegalese respondents showed similarly high levels of agreement (3.48), with no statistically significant variation along ethnic or religious lines; for example, the responses of the Wolof (3.43) and the Pulaar (3.41) were nearly identical. Contrary to the question of electoral credibility, there was no division in either Senegal or Sierra Leone between urban and rural respondents.
1.3. In your experience, does the court system provide equal and fair access to justice?
In Sierra Leone, a plurality of Temne respondents said the court ‘never’ provides equal and fair access to justice. The mean result for the entire country was 1.56 on a scale of 0 to 4. A plurality of Mende respondents answered ‘sometimes’, with a group mean of 1.80—significantly higher than results of the other ethnic groups surveyed. The frequent negative responses across most minority groups may be tied to the overall perception of corruption within public institutions, including the judiciary (Thompson 2016). Conversely, the somewhat more positive responses of Mende individuals could also be linked to this ethnic group’s political alignment with the ruling SLPP, although this effect appears to be marginal, and trust in the judicial system’s capacity appears to be low in all cases (Lavali and M’Cormack-Hale 2022). Low-income Sierra Leoneans (1.78) are slightly more favourable than respondents across the rest of the income distribution (1.45), while both groups are pessimistic about the ability of the courts to administer justice.
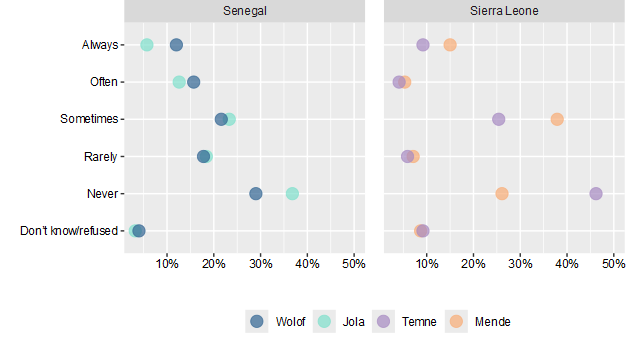
In Senegal, a plurality of people across all ethnic groups reported that the courts ‘never’ provide equal and fair access to justice, with little statistical variation observed across most ethnic and religious groups. The mean value for the country was 1.53 (out of a possible 4.00), roughly in line with Sierra Leoneans’ moderately pessimistic responses. There was a moderate statistical difference observed between the Wolof and Jola groups. While a plurality from both groups responded ‘never’, the group mean for the Wolof (1.62) was higher than that of the Jola (1.30). There was little variation in responses, which aligns with research indicating that, over the past few decades, ethnicity and religion have become less significant as a political and social cleavage in Senegal (Cheeseman and Ford 2007).
1.4. Do you have the freedom to pursue the goals that matter to you and to build the kind of life that you want for yourself?
In Sierra Leone, Mende (3.41 out of a maximum of 4.00) respondents were more likely to say that they enjoy this sort of freedom than Temne (2.81) respondents. The mean response for the country as a whole was 3.17, between ‘often’ and ‘all the time’. This result aligns with the broader findings of this analysis, where the Mende are more positive about the integrity of elections and the quality of access to justice, likely due to their confidence in and support for the ruling party.
On a broader level, religion does not appear to be a significant fault line, as the country is well known for its religious tolerance, reflected in the country’s high performance in Freedom of Religion in the GSoD Indices (International IDEA n.d.a; UN OHCHR 2013).
In Senegal, a plurality of people across all ethnic groups reported that they ‘always’ feel free to pursue their goals, with no significant differences observed across different groups. The mean score for the country as a whole was 2.30.
While no statistical variation was observed between majority groups like the Sunni and minority groups like Catholics and other Christian groups, a large and statistically significant difference was observed between Sunni (2.39) and those identifying as a member of other Muslim groups (1.87). The higher mean score for the Sunni group indicates a greater sense of freedom to pursue their goals compared with other Muslim groups; a plurality of the latter responded that they ‘never’ experienced such freedom. Although there are ongoing sectarian tensions within Islam in contexts such as Western Asia, Sierra Leone has a notable history of religious tolerance among various Muslim sects, including Ahmadis, Sunni and Shia (United Nations General Assembly 2013; Day 2020; Council on Foreign Relations 2023). However, isolated conflicts have occurred between majority Muslim groups and smaller movements or secret societies, which could explain the discrepancy described above and may deserve further scrutiny (United States Department of State 2024; Thomas 2025).
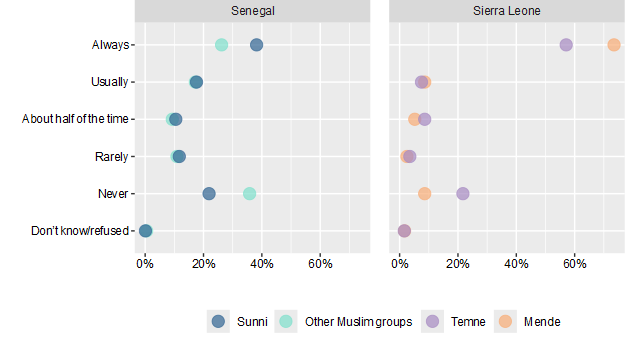
Across urban–rural divides, respondents living in rural areas (2.05) and suburbs (2.20) were also significantly more likely than those living in cities (2.70) to say that they ‘never’ experienced this freedom. This discrepancy is likely linked to the fact that urban residents have better access to resources than people living in rural areas.
Gender is a larger divide than ethnicity or religion on this question, with men (2.53) being significantly more likely than women (2.08) to respond positively. Similarly, respondents who were not in the low-income sample (2.39) were more likely to provide a positive response than low-income respondents (2.11).
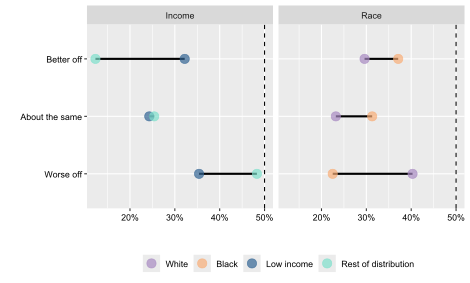
1.5. Comparing your personal economic conditions with those of your parents when they were about your age, would you say that you are better off, worse off or about the same?
The mean for Sierra Leone is 1.16 (out of a possible 2.00), suggesting parity with the previous generation’s economic conditions. A plurality of Mende (1.26) stated that they were better off than their parents. This somewhat positive sentiment may be linked to differing experiences of generations since the civil war, a period that likely affected the previous generation’s economic circumstances due to the economic downturn that accompanied the war. Temne (1.04) and minority Mandingo (0.96) respondents—predominantly found in northern regions of Sierra Leone, which were heavily affected by the war and are still recovering—were slightly more likely to say that they were worse off than their parents compared with the Mende, resulting in a marginally lower average response score. However, it is difficult to distinguish between perceptions affected by the civil war and those stemming from the fact that Mandingo and Temne respondents are likely supporters of the opposition APC. There were also modest differences between men (1.21) and women (1.11), and low-income respondents (1.29) were slightly more likely to say they were better off than their parents than respondents from across the rest of the income distribution (1.10). Low-income respondents may view their economic progress positively by comparing it to the harsher conditions their parents faced during the civil war era, as even modest improvements like better roads and food security can feel significant (IMF 2019).
In Senegal there were no statistically significant differences between nearly all religious and ethnic groups on these questions. The mean for Senegal as a whole is 1.05, marginally lower than that of Sierra Leone.
1.6. How satisfied are you with the overall performance of the national government in your country?
In Sierra Leone (2.03 out of a possible 4.00), Mende (2.44) respondents were more likely to say they were satisfied with government performance compared with Temne (1.72) respondents, likely once more reflecting the country’s partisan polarization along ethnic lines. This discontent, combined with an ongoing cost-of-living crisis and high unemployment rates, contributed to an attempted coup in November 2023 (Jones 2023; International IDEA 2024a).
Along religious lines, Sunni respondents (1.96) were also more likely to say they were dissatisfied with the government’s performance compared with Catholic respondents (2.23). Men (2.11) were more likely to be satisfied than women (1.94), and low-income respondents (2.27) were more likely to be satisfied than the rest of the population (1.91). Perceptions of government performance did not differ significantly between urban and rural areas.
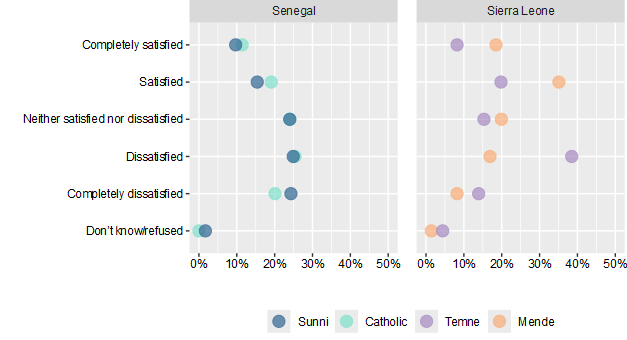
In Senegal (1.59), a plurality of people across all ethnic groups reported being dissatisfied with government performance, with majority groups like the Wolof (1.52) also more likely to say they were completely dissatisfied than Pulaar (1.75) respondents. Contrary to the partisan effect observed in other countries, these negative sentiments may be associated with several overarching factors, including high poverty rates, a struggling economy and high youth unemployment rates (Yeboah 2024). Perceptions of government performance did not differ across religious lines or between urban and rural areas.
Key takeaways
- Racial groups in the USA provided relatively uniform assessments of electoral credibility, but there is a large urban–rural cleavage, as well as moderate differentiations along religious lines; in India, Muslim respondents are less likely than Hindu respondents to find elections credible.
- In the USA, ethnic differences were less pronounced than expected, with perceptions varying more across geographical and religious lines; minority groups expressed more favourable views of the court system, government performance and economic progress compared with majority groups, possibly due to partisan influences.
- In India, minority respondents were more pessimistic than majority groups regarding the court system and government performance.
India, which performs in the mid-range in all four GSoD categories, is the most populous country in the world and is home to several religious communities and 22 officially listed linguistic groups. Since independence from Great Britain, the country’s politics has been the locus of two competing histories—one of pluralism and multiculturalism and another focusing on India as, first and foremost, a country of and for Hindus and Hinduism. Much of the country’s political contestation takes place along this axis, as governments negotiate socio-economic and religious cleavages among the country’s vast population while negotiating the relationship between these competing histories. More recently, Prime Minister Narendra Modi has attempted to appeal across this divide by rhetorically framing Hinduism as a cultural identity that can encompass minority religions (International IDEA 2025c; Press Trust of India 2015).
The USA is high-performing in all four GSoD categories and within the top 25 per cent of all countries in most factors. It is increasingly ethnically diverse and economically unequal, as decades of rising income inequality has resulted in the top 10 per cent of citizens holding 70 per cent of national wealth. Racial and ethnic minority groups have fewer economic opportunities and are more likely to live in poverty or experience incarceration. The racial aspect of US inequality has become more salient in national politics in recent years thanks to the Black Lives Matter movement and its backlash, which has seen the weakening of landmark voting rights legislation as well as the accompanying overall decline in the country’s democratic institutions and concentration of power in the presidency under Donald Trump (International IDEA 2025f).
For the USA, this chapter will focus on racial and religious cleavages. For India, the focus will be on religious cleavages alone, as the PODS data set does not have granular ethnic, caste or tribal identifiers for respondents.
2.1. Taking into account election day, the election campaign and the vote-counting process, would you consider the most recent national election to have been free and fair?
The mean response for the USA was 2.26 (out of a possible 4.00), and there were no significant variations between racial groups. There was, however, differentiation along religious lines. Protestants (2.03) professed the lowest level of trust in electoral credibility, followed by Catholics (2.35).8,9 Largely non-religious respondent groups were on average more positive, including agnostics (2.87) and atheists (3.29). As a group, Protestants professed less faith in the election, likely as a result of white Evangelical Christians’ overwhelming support for Donald Trump, with the strength of negative sentiment exacerbated by Trump’s persistent false claims that the 2020 election—the most recent presidential election at the time this survey was conducted—was ‘stolen’ from him (Crowley 2020; Newport 2020).
The comparatively high assessments of non-religious voters lend support to the ‘secular values voters’ thesis, which argues that these Americans constitute a political bloc particularly concerned with protecting the separation of church and state (Stewart 2023). Given Trump’s outreach to white Evangelical voters, it is reasonable to conclude that non-religious voters overwhelmingly supported his opponent and thus would be much less likely than other voter cohorts to agree with conspiracy theories about the validity of the election.
Similar differences in responses were found along geographical lines, where respondents living in cities (2.43) and suburbs (2.41) expressed more faith in electoral credibility than Americans living in rural areas (1.82). This disparity is larger than the one seen when respondents are divided according to income, where the average score of low-income respondents was 2.15, compared with 2.32 for the remainder of the population within the urban–rural split.
Divisions among Americans along geographic lines have been well documented (Fiorina and Abrams 2008; Johnston, Manley and Jones 2016). While public discourse frequently describes a forward-looking, progressive urban America and a traditional, rural America clinging to old ways while being left behind, in reality populated rural and urban areas in the USA are largely economically and socially interdependent regions. The diverging political perceptions presented here are likely a product of this process of integrated economic and social development rather than a case where one group or the other is departing from previous commonly held values and beliefs (Lichter and Ziliak 2017). It may also be the case that this divide is in part psychological: ‘urban’ and ‘rural’ are not neatly defined geographical terms in the USA, and respondents may have assigned themselves to one or the other group as much out of perceived cultural affinity as any other factor. This divide should be seen not as a conflict between forward- and backward-looking social groups but as a mutually reinforcing construction of social classes whose interaction may change the nature of American democracy and politics in unpredictable ways (Mettler and Brown 2022).
In India, the mean score was 2.05 (out of a possible 4.00). Hindus (2.17) expressed higher confidence in the 2020 election than Christians (1.72) and Muslims (1.65), reflecting the steady shift under Prime Minister Narendra Modi to more explicitly Hindu majoritarian politics (Vaishnav 2020). Political rhetoric that is understood by minority groups as marginalizing or denying their status as full and equal political citizens would be expected to damage those groups’ belief that elections are being contested on an equal playing field (Jafri et al. 2024). Lower-income respondents (1.86) were also more critical than respondents across the rest of the income distribution (2.16) to a similar degree to the aforementioned religious divide. This pessimism may stem from these communities’ vulnerability to electoral disenfranchisement and malpractices such as vote buying (Heath and Tillin 2018; Bora 2024). Perceptions of electoral credibility did not differ significantly along ethno-linguistic lines or between urban and rural areas.10
2.2. Voting is a meaningful way of impacting the government
The responses to this statement were assigned values ranging from 0 to 4, where scores approaching 0 indicate strong disagreement; scores around 2, ambivalence; and scores approaching 4, strong agreement.
In the USA, there were only minor differences between racial or religious groups, none of which were statistically significant. However, American respondents overall (2.76) were far less likely to agree that voting could influence decision makers than Sierra Leonan (3.45) or Senegalese (3.48) respondents. The US score is tied with that of Colombia (2.77) as the lowest average response of all countries examined in this report.
The significantly stronger belief among respondents in Sierra Leone and Senegal in the utility of voting does not translate into higher levels of electoral participation: in each country’s most recent election before PODS data were collected, turnout among the voting-age population was 62.36 per cent in the USA, 59.61 per cent in Sierra Leone and 36.92 per cent in Senegal. Although a belief in the value of voting itself may not be the primary factor influencing electoral turnout—a myriad of other social, political and geographic forces affect voters’ desire to take part in elections (Stockemer 2016)—continued participation may indicate a sense of optimism among American voters, who, despite frustration over how particular electoral processes impact policymaking, have not abandoned democratic processes entirely.
Social groups’ mean level of agreement with this question and data on turnout among the voting-age population can be seen in Figure 2.3.
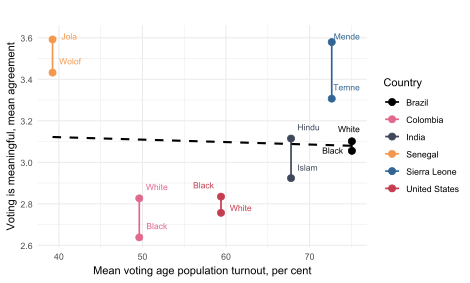
Americans continue to be divided by geography. There were small but statistically significant differences in the mean responses for urban (2.83), suburban (2.90) and town-dwelling (2.82) respondents, on the one hand, and rural (2.43) respondents, on the other. To return to the previous theme of the social construction of urban–rural identities, it is worth noting that, at the national level, the votes of rural-based US citizens count, in most cases, more than the votes of urban and suburban residents due to the system used to apportion seats in the House of Representatives and the Senate (Badger 2016; Balz, Morse and Mourtoupalas 2023). These differences in perceptions of the value of voting can be seen in other surveys and are also correlated with a higher propensity to profess anti-democratic views (Schaller 2024). Low-income Americans (2.55) hold more negative views than the rest of the population (2.88), though this division is not as significant as the urban–rural geographical divide.
In India, Hindus (3.11) were more likely to say voting was meaningful than Muslims (2.92) and Christians (2.73), with the mean score for the country (3.02) equivalent to the response ‘somewhat agree’. A less pronounced but similar difference can be observed between urban (3.10) and rural respondents (2.94), men (3.11) and women (2.91), and low-income individuals (2.84) and the rest of the population (3.13). Taken together with Indians’ responses to the previous question on electoral credibility, these results indicate general faith in the value of elections qua elections, with a marginally more pessimistic reaction among traditionally more socio-economically disadvantaged groups of all kinds. For example, Muslims have been historically under-represented in Indian politics, and the situation has deteriorated in the past decade (Farooqui 2020; Khan 2024). The ruling Bharatiya Janata Party (BJP) has also historically been less popular with Indian women but has made significant gains in recent electoral cycles (Chowdhury 2024; Mehrotra and Shih 2024).
2.3. In your experience, does the court system provide equal and fair access to justice?
In the USA, the mean response to this question was 1.90 (out of a possible 5.00), indicating an average response between ‘rarely’ and ‘sometimes’. A previous PODS report revealed significant disparities in access to the court system, particularly among self-identified minorities, who often responded ‘rarely’ or ‘never’ to this question about fair access (International IDEA 2024b). Yet, contrary to what one would expect, the disaggregated data show little variation by ethnicity in these responses.11 This finding may stem from the fact that racial minorities frequently express more trust in government and optimism about racial justice than white Americans under administrations that are seen to prioritize racial equality (Wu, Wilkes and Wilson 2022).
There were significant differences across religious lines. The group mean for Catholics (2.23) was significantly higher than for Protestants (1.93), atheists (1.55) and those who said they did not know what their religious affiliation was (1.70). As with Protestants’ perceptions of electoral credibility, the negative responses could be linked to certain Protestant communities’ (especially white Evangelicals’) prevalent views that mainstream institutions like the judiciary have been weaponized by the Democratic Party, especially in the aftermath of the 6 January 2021 Capitol riots involving Donald Trump and his supporters (PRRI 2024).
Differences can also be found along gender and economic lines but not to the same degree as along religious lines. Men (2.04) were more likely than women (1.79) to claim that the court system provides access to justice, and low-income respondents (1.74) were less likely than the general population (1.98) to make such a claim.
The urban–rural divide was also significant. Rural respondents were notably less likely to report that the court system ‘always’ or ‘often’ provides equal and fair access to justice compared with respondents in cities, suburbs and towns. This more negative perception among rural respondents is likely due to barriers such as distance to courthouses, poverty and delays in receiving legal assistance (United States Department of Justice 2025).
In India, while a plurality across most groups reported that they ‘sometimes’ had equal and fair access to the courts, significant variations exist along religious lines. Although the mean response for the country as a whole was 2.11, the group mean for Hindus (2.15) was significantly higher than for Muslims (1.93). As before, there was a similar division between low-income (1.92) and other respondents (2.22). As low-income respondents can be assumed to overlap significantly with lower-caste Indians, it is likely that this relative scepticism is a result of lingering discrimination against lower-caste Indians despite significant legal and political efforts to counteract it (Waughray 2022).
The differences in responses among religious groups in India are particularly striking, especially when compared with the lack of statistically significant variation found in the USA. This discrepancy could be linked to the Indian judiciary’s inconsistency in upholding Muslims’ constitutional protections and the persistence of discriminatory laws and extra-legal violence (Maizland 2024). Moreover, some scholars suggest that this failure mirrors the Jim Crow era in the USA, where, over many decades, courts have been slow to provide marginalized groups with adequate protection (Varshney and Staggs 2024).
2.4. Do you have the freedom to pursue the goals that matter to you and to build the kind of life that you want for yourself?
In the USA, there were no statistically significant differences across racial or religious groups in perceptions of the freedom to pursue one’s goals. The mean score for the country was 2.51 on a scale of 0 to 4, with 0 indicating ‘never’ and 4 indicating ‘always’. Urban–rural divides were a more meaningful predictor of differing perceptions, with those residing in cities (2.58) more likely to choose ‘always’ than those residing in rural areas (2.32). There was a similar pattern in terms of income, where low-income respondents were more pessimistic (2.20) than the rest of the population (2.68).
In India, members of the majority religious Hindu group (2.78) were also more likely than Muslim respondents (2.49) to respond that they ‘always’ had the freedom to pursue their goals (Maizland 2024). Men (2.79) were more likely than women (2.54) to say that they had such freedom, while low-income respondents (2.48) were less like than the general population (2.78) to say that they had such freedom. The country as a whole had a mean score of 2.68.
Box 2.1. The gender gap in perceptions of democracy
In Brazil, India and Senegal, men are significantly more likely than women to say they have the freedom to pursue their goals. The optimism expressed by men, in contrast with women, may stem from entrenched patriarchal norms that position men as primary decision makers in households and socio-political settings. These norms often perpetuate gender-based violence and discrimination, limiting women’s autonomy, opportunities and sense of security. Gender-based violence, though not unique to Brazil, India and Senegal, remains a pressing issue in these countries due to high rates of femicide, political violence and intimate partner violence (UN Women n.d.; Kumari et al. 2025; Miklos and Bueno 2025). Research shows that the prevalence of intimate partner violence also tends to be the highest among poorer households and women living in rural areas in India and Senegal (UNFPA 2021; Manna et al. 2024). According to the GSoD Indices, all three countries are considered mid-performing in Gender Equality, although Brazil (0.66) and Senegal (0.60) are just below the threshold for high performance (0.70), while India (0.40) is slightly above the threshold for low performance. Although countries like India and Senegal have made significant strides in advancing women’s financial inclusion in recent years, key systematic barriers and restrictive patriarchal norms continue to hinder their full participation (GIWPS and PRIO 2023).
2.5. Comparing your personal economic conditions with those of your parents when they were about your age, would you say that you are better off, worse off or about the same?
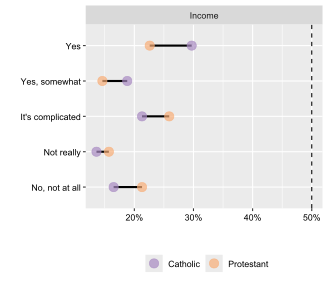
The USA stands out for its starkly differing views on personal economic conditions among ethnic and religious groups. It also has the lowest overall mean of all countries examined, at 0.85 (out of a possible 2.00). It was the only country where the mean was lower than 1.00—indicating that only in the USA, alone among the six countries mentioned in this report, were respondents more likely to say they were worse off, not better off, than their parents. Given the strength and dynamism of the US economy in recent decades, this result may initially be surprising. However, there is no clear line between economic outcomes and perceptions of economic outcomes: the latter are mediated through public expectations, media effects and numerous other social forces. This is not to say that the pessimism of comparatively wealthy Americans is not reflected in real economic experiences: the incomes of the richest Americans declined precipitously in the aftermath of the 2008 global financial crisis, and the full impact of the Covid-19 pandemic on wealth distribution in the country is still not fully understood (Milanovic 2022).
White Americans (0.78) were significantly more likely to claim that they were worse off compared with Asian (1.31), Black (1.06) or Hispanic (0.97) respondents. Recent studies indicate that Black Americans’ positive views of their economic progress may stem from improved intergenerational mobility, with Black millennials earning more than their parents (DeSmith 2024). Conversely, earnings have fallen among white low-income households, with widening gaps between low- and high-income white Americans. However, income is the strongest predictor for Americans who answered this question, as low-income respondents were the most likely to say they were worse off (0.59) and were far more pessimistic than respondents across the rest of the income distribution (0.98). Additionally, the PODS data show that city residents were more likely to say they were better off than respondents in rural areas.
Across religious lines, Protestants (0.83) were also significantly more likely to express negative views of their economic progress compared with minority groups like Catholics (1.08). These negative sentiments are somewhat expected, as the poll was taken during the Biden administration, and a majority of Protestant registered voters are traditionally aligned with the Republican Party (Pew Research Center 2024). Additionally, more recent surveys show that many Republicans, who previously believed that the economy was worsening, immediately changed this view after Donald Trump’s 2024 electoral victory—highlighting how partisanship significantly influences perceptions (Romano 2024). A similar yet less dramatic shift in the opposite direction was seen among Democrats. Economists have noted similar trends in the USA in consumers’ perceptions and expectations, where surveys that once closely tracked macroeconomic indicators now find party affiliation to be a stronger predictor of economic outlooks than income, age or education (Hsu 2025).
Unlike the USA (0.85), no significant differences were found in India (1.14) between different religious groups regarding economic progress. A plurality of respondents across most groups expressed feeling ‘better off’ than their parents, reflected in the country’s progress in the Human Development Index over the past two decades (UNDP 2022). There is a slight difference between low-income Indians (1.08) and the rest of the distribution (1.17), but both groups are relatively optimistic compared with respondents from other countries.
2.6. How satisfied are you with the overall performance of the national government in your country?
In the USA (1.52), white (1.40) respondents were significantly more likely to report being dissatisfied with government performance than Black (1.99) and Hispanic (1.78) minority group respondents. The same unfavourable outlook among majority groups was observed across religious lines, where Protestants (1.35) expressed more dissatisfaction than Catholic (1.97) minority group respondents. Catholic respondents were also more likely to express being satisfied than both atheist (1.15) and agnostic (1.34) respondents. Like Americans’ perceptions regarding their personal economic conditions, the pessimism seen among majority groups may largely be attributed to their political affiliations and discontent with the ruling Biden administration at the time of the survey (early 2024).
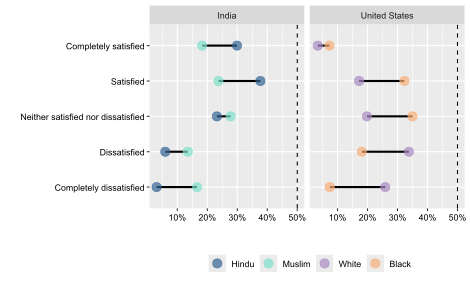
Across urban–rural divides, respondents living in cities (1.85) were also significantly more likely to say they were satisfied with government performance than those living in rural areas (1.15), the suburbs (1.46) and towns (1.34). Compared with respondents from other countries, Americans of all stripes are largely dissatisfied with their government.
In India (2.62), the Hindu majority (2.81) was significantly more likely to express being satisfied with government performance than Muslim (2.17) and Christian (2.28) respondents. This discrepancy could be attributable to the ruling BJP’s political emphasis on the centrality of Hinduism to Indian identity and the spectrum of policies with varying levels of accommodation for national religious minorities that this core principle entails (Swamy 2024). As in the USA, those living in Indian cities (2.75) were also significantly more likely to say they were satisfied with the government’s performance than those living in rural areas (2.54), suburbs (2.40) and towns (2.50). Men (2.70) were more likely to be satisfied with the government than women (2.51), and low-income group respondents (2.50) were less satisfied than respondents across the rest of the income distribution (2.68).
Key takeaways
- In Brazil, perceptions of election fairness varied by religion, with majority Protestants being more sceptical than minority Catholics. In contrast, Colombia showed no significant divides, but respondents had the most pessimistic views in the data set overall.
- In Brazil, many respondents reported that they were better off than their parents, indicating a sense of upward mobility. Conversely, the effects of historical violence contributed to a more pessimistic outlook on economic progress in Colombia, particularly among low-income individuals.
Brazil performs in the high range in the categories of Representation and Participation and in the mid-range in Rights and Rule of Law. The country has seen a significant reduction in poverty in the last 25 years, resulting from strengthened labour and pension laws and cash-transfer programmes. It remains one of the most unequal nations in Latin America, and poverty is a major driver of politics.
Brazil is a diverse country with no statistically dominant ethnic group; the population consists of a mix of the descendants of European colonists, African slaves and Indigenous peoples. Despite a popular myth of Brazil as a ‘racial democracy’, economic and social inequality commonly manifests along racial lines. Religious identity is also a burgeoning political cleavage, as strains of Evangelical Protestantism have become more popular in the formerly largely Catholic country (International IDEA 2025a).The country has also had a turbulent constitutional history, including a repressive, 21-year military dictatorship which ended in 1985.
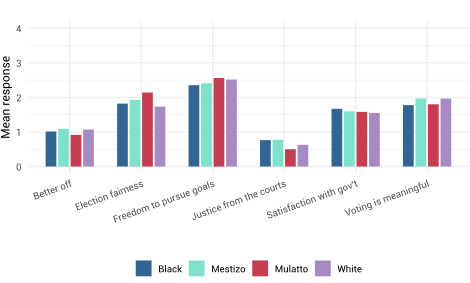
Colombia performs in the mid-range in all categories of the GSoD framework. It is a diverse and multicultural country, with significant minority Afro-Colombians and Indigenous populations. However, these minorities disproportionately live in poverty and are more likely to suffer from forced displacement. Gender-based violence remains a significant national issue and also disproportionately affects minority groups (International IDEA 2025b). Colombia has had a far more violent recent history than most of its Latin American neighbours, including a 10-year civil war known as La Violencia (1948–1958), an ongoing conflict with various leftist guerrilla groups that began in 1964, and conflicts with powerful drug-trafficking cartels that reached their peak in the 1970s and 1980s.
For Brazil, this chapter will primarily focus on religious and racial cleavages. For Colombia, where race and ethnicity showed minimal variation, the focus will be on the enduring impact of armed conflict and poverty as a cleavage.
3.1. Taking into account election day, the election campaign and the vote-counting process, would you consider the most recent national election to have been free and fair?
Brazilian respondents differed little along self-identified racial lines, but patterns along religious lines resembled those seen in the USA: Protestants (2.14) were more sceptical than Catholics (2.58), who in turn were more sceptical than the atheist and agnostic minority (3.09). The country’s mean score was 2.47. The roots of this phenomenon were likely political, as in the USA: Brazilian Evangelicals were much more likely to support former President Jair Bolsonaro, who was defeated by President Luiz Inácio Lula da Silva in the 2022 election—the election that PODS respondents were being asked to consider (Jeantet and Savarese 2022). Like India, Brazil also lacks a division along geographic lines.
In Colombia, there was no statistically significant difference between religious or ethnic groups. However, the country had the lowest mean score in the data set, at 1.85. Rural respondents (2.13) were slightly more likely than urban respondents (1.82) to assess the most recent election as fair. This finding could be a result of President Gustavo Petro’s relatively stronger performance in rural Colombia than that of his opponents in the 2022 presidential election (Llaneras, Andrino and Pires 2022).
3.2. Voting is a meaningful way of impacting the government
For the purposes of this analysis, the responses to this question were assigned values ranging from 0 to 4, whereby scores approaching 0 indicate strong disagreement; scores around 2, ambivalence; and scores approaching 4, strong agreement. In Brazil (3.07) and Colombia (2.77), there were no statistically significant differences in responses to this statement by race, religion or geography. While Colombia’s mean score may seem low in comparison with Brazil’s, it is identical to the USA’s. Colombians, however, were much more likely to agree with the statement than Americans were: whereas Americans were starkly divided along geographic lines on this and other questions, the only statistically significant difference in Colombia was between the low-income group (2.62) and the rest of the population (2.85).
3.3. In your experience, does the court system provide equal and fair access to justice?
There was no significant variation between responses based on religion, race or ethnicity in Brazil (1.46) or Colombia (1.25). In Colombia, the 2024 PODS report highlighted a large gap at the lower end of the response options, with self-identified minorities more likely to respond that the courts ‘rarely’ or ‘never’ provide access to justice (International IDEA 2024b). When minority populations are disaggregated, however, the results include several groups whose numbers are insufficiently large to enable robust analysis: in the case of Colombia, these groups include Indigenous, Mulatto and those who preferred not to provide their racial or ethnic identity. When the alternative measure of self-identified minority status is used instead, the effect remains.12
3.4. Do you have the freedom to pursue the goals that matter to you and to build the kind of life that you want for yourself?
In Brazil (2.79) and Colombia (2.42), a plurality of respondents across all religious and ethnic groups say they either ‘usually’ or ‘always’ have the freedom to pursue their goals, with no significant variation among different groups. This question was scored on a 0–4 scale. There was also no statistically significant difference based on income or geography. In Brazil, however, men (2.95) were more likely to answer positively than women (2.72).
3.5. Comparing your personal economic conditions with those of your parents when they were about your age, would you say that you are better off, worse off or about the same?
There were minimal differences among ethnic and religious groups in Brazil (1.41 on a scale of 0 to 2) and Colombia (1.06). In Brazil, a plurality of respondents from these groups reported feeling better off than their parents. In Colombia, however, this sense of optimism was less pronounced and varied between groups. The results may initially be surprising given the extreme levels of political violence in Colombia fuelled by the drug trade in the 1980s and 1990s—a deeply traumatic period that one would suspect Colombians are glad to have behind them (Richani 1997).13
However, large-scale exposure to violence during these decades can instead foster persistent pessimism about the very possibility of upward mobility; for many individuals, the psychological consequence of systemic political violence is a sense of progress that is, by definition, out of reach (Moya and Carter 2014). Similar patterns can be observed in other regions that were subjected to comparable levels of mass violence and displacement, such as Guatemala’s Western Highlands (Copeland 2011). This effect appears to be more pronounced among low-income respondents (0.97), who answered more negatively than the rest of the population (1.11).
3.6. How satisfied are you with the overall performance of the national government in your country?
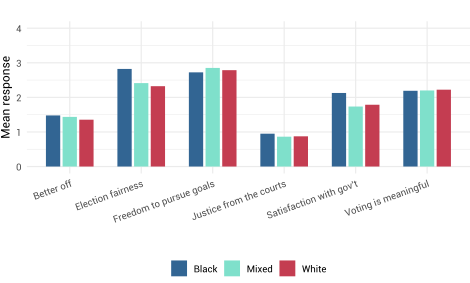
In Brazil (1.85), minority Black (2.13) respondents were slightly more likely to say they were satisfied with government performance than white (1.79) respondents—a similar finding to that of the USA. This result may again be attributed to the election of a pro-poor, leftist president in 2022 who advocated racial equality among his diverse supporter base (Molina 2022; Harris and Ingizza 2023). Along religious lines, there were statistically significant variations between Catholic (2.02) and minority Protestant (1.69) respondents, with Catholics slightly more likely to be satisfied. A similar pattern could be seen between Catholics and other Christian groups, with the former again more satisfied. Perceptions of government performance did not differ between urban and rural areas, but they did vary by gender, with women (1.90)—contrary to the general trend in the data set—more positive about the government’s performance than men (1.74).
In Colombia (1.57), perceptions of government satisfaction did not differ across ethnic lines or between urban and rural areas. Contrary to the finding for Brazil, women (1.51) were less positive towards the government than men (1.65).
Democracies that embrace pluralism are better equipped to navigate crises and complex challenges. These societies benefit from diverse viewpoints, which ultimately lead to more effective problem solving and innovation. However, embracing pluralism requires first pinpointing the fault lines that exist within any given society (Stewart 2017).
The data reveal that minorities often are more critical of institutions than majority groups in countries such as India and Sierra Leone. Yet, identifying which specific groups feel included or excluded is not straightforward. Diversity is not inherently divisive, and this report demonstrates that social differences do not always translate into political divisions, as shown in the contrasting examples of Senegal and Sierra Leone and of Brazil and Colombia. While both pairs of countries share broad-based historical backgrounds, perceptions among the Senegalese are not as ethnically divided as in Sierra Leone, and Brazilians generally view their democracy more positively than Colombians. Overall, these perceptions show that negative or polarized outcomes are not inevitably determined by history or colonial experiences.
Instead, the findings suggest that social differences become divisive under certain social conditions, particularly when elites have incentives to foster such divisions, and when political and democratic institutions lack the strength to constrain or counteract such forces. Research shows that ethnicity becomes politicized when colonial legacies, socio-economic inequalities and weak institutions align to make identity a strategic tool for political gain (Weber, Hiers and Flesken 2016; Houle and Conroy-Krutz 2025).
The discrepancies highlighted between majority Hindu and minority Muslim groups in India underscore the need to strengthen trust in key democratic institutions—elections that deliver representative and effective governments, as well as a judicial system that administers fair and equitable justice. Addressing these challenges requires a deep reckoning with past injustices, improved representation and the active involvement of minority communities in decision-making processes to counter perceived institutional discrimination. The same can be said of other countries whose troubled past manifests in lower overall faith in democratic institutions (Colombia) or that are deeply polarized (Sierra Leone).
Elsewhere, such as in the USA, divisions are less about ethnicity and religion and more about politics. For example, the gap in perceptions between self-identified supporters of President Donald Trump and other Americans is the widest among all divides analysed in this report. This finding suggests that media- and elite-driven resentment politics may pose a greater threat to democracy in the future than religious, cultural or ethnic divides. Bridging these gaps and encouraging diverse perspectives will require investments in meaningful cross-party dialogue, forums for inclusive public discourse and independent media. While the good news may be that America’s divides may be shallower than they seem at the popular level, its current political elites may struggle to reconcile without significant institutional change.
It is encouraging that many members of minority and otherwise disadvantaged groups surveyed for this report still view voting as a meaningful avenue for impacting the government, indicating a foundational belief in democratic participation. As shown above in Figure 2.3, this includes all social groups covered in this report, with only minor variations within countries.14
However, there appears to be little observable relationship between believing that voting is important and the act of voting itself. At the level of the social group, it appears that the structure of democratic institutions—Brazil has mandatory voting, whereas voter registration in the USA is famously laborious—more than personal preferences or socio-economic factors is what drives higher voter turnout. This dynamic is part of a broader phenomenon that goes beyond the simple act of voting: dissatisfaction with existing democratic systems is not the same as dissatisfaction with democracy itself. Rather than resulting from weak demand for democracy or a public preference for authoritarian rule, the disengagement of the public—or individual social groups—from political processes is instead driven by shortcomings in democratic systems themselves.
That the problem goes beyond voter turnout should not lead to pessimism about the potential for improvement. An equitably representative government is more likely to deliver to its diverse constituents, and working to expand the informed use of the franchise can be one step towards a more engaged citizenry.
While the data offer important insights into democratic resilience, it is crucial to note that democratic resilience does not imply reinforcement of the status quo. Many democratic institutions struggle to serve all citizens equitably. Perception surveys with disaggregated demographic data can help identify where systematic inequalities exist and provide the necessary tools to ameliorate them.
Ultimately, there is a pressing need for more disaggregated data related to popular perceptions in understanding the factors that influence people’s assessments. In many countries, detailed demographic data are often insufficient or lacking. Addressing these gaps remains a critical task; accomplishing that task will play a crucial role in fostering more equitable, resilient and pluralistic societies (International IDEA 2025g). Importantly, the task of proactively building robust and resilient democratic institutions is far less daunting than the effort required to pull a country back from the verge of crisis. While the ideal time to build strong, representative institutions was 20 years ago, the next-best time is now.
Box 4.1. Who is a minority?
The question of minority status is perhaps more complicated than it first appears. Members of groups that appear to be minorities from the perspective of national statistics and expert judgment may not see themselves as such.
This finding is well illustrated by the PODS data, where respondents’ perceptions of their minority status frequently do not match official categories or even broadly accepted popular understandings. For example, 62 per cent of Black respondents in the USA did not identify themselves as a minority, while 15 per cent of white respondents did. About one third of respondents from Sierra Leone’s two main ethnic groups, the Mende and the Temne, identified as minorities, while two thirds of each group did not. Although Muslim Indians account for less than 15 per cent of the population, only half of them self-identified as minorities.
These differences are not necessarily the result of errors or misunderstandings. Respondents who are, objectively speaking, a statistical minority in their country may not see this as their primary marker of identity. Muslim Indians or Black Americans may reside in a neighbourhood or city where they are the statistical majority, or subnational or international identities may trump national identity for certain individuals. In countries like Brazil and Colombia, racial categories themselves are highly permeable and contingent on context (Bailey and Fialho 2018).
Badger, E., ‘As American as apple pie? The rural vote’s disproportionate slice of power’, The New York Times, 20 November 2016, <https://www.nytimes.com/2016/11/21/upshot/as-american-as-apple-pie-the-rural-votes-disproportionate-slice-of-power.html>, accessed 22 May 2025
Bailey, S. R. and Fialho, F. M., ‘Shifting racial subjectivities and ideologies in Brazil’, Socius: Sociological Research for a Dynamic World, 20/9 (2018), <https://doi.org/10.1177/2378023118797550>
Baleyte, J., Gethin, A., Govind, Y. and Piketty, T., ‘Social Inequalities and the Politicization of Ethnic Cleavages in Botswana, Ghana, Nigeria, and Senegal, 1999-2019’, World Inequality Lab, September 2020, <https://wid.world/document/social-inequalities-and-the-politicization-of-ethnic-cleavages-in-botswana-ghana-nigeria-and-senegal-1999-2019-world-inequality-lab-wp-2020-18>, accessed 27 October 2025
Balz, D., Morse, C. and Mourtoupalas, N., ‘The hidden biases at play in the U.S. Senate’, The Washington Post, 17 November 2023, <https://www.washingtonpost.com/politics/interactive/2023/us-senate-bias-white-rural-voters>, accessed 22 May 2025
Bora, B., The Absent Voters of India: Challenges and Prospects for the Enfranchisement of Migrants (Stockholm: International IDEA, 2024), <https://doi.org/10.31752/idea.2024.101>
Bourdieu, P., ‘What makes a social class? On the theoretical and practical existence of groups’, Berkeley Journal of Sociology, 32 (1987), pp. 1–17, <http://www.jstor.org/stable/41035356>, accessed 20 May 2025
Carter Center, The, ‘Final Report: General Elections in Sierra Leone’, 24 June 2023, <https://www.thesierraleonetelegraph.com/wp-content/uploads/2023/12/The-Carter-Centre-Final-Report-Sierra-Leone-2023-2.pdf>, accessed 25 September 2025
Cheeseman, N. and Ford, R., ‘Ethnicity as a Political Cleavage’, Afrobarometer, Working Paper No. 83, November 2007, <https://www.afrobarometer.org/wp-content/uploads/2022/02/AfropaperNo83.pdf>, accessed 29 September 2025
Chowdhury, A., ‘How the BJP wins over women’, Carnegie Endowment for International Peace, 26 April 2024, <https://carnegieendowment.org/research/2024/04/how-the-bjp-wins-over-women?lang=en>, accessed 25 September 2025
Coates, T.-N., ‘The case for reparations’, The Atlantic, 22 May 2014, <https://www.theatlantic.com/magazine/archive/2014/06/the-case-for-reparations/361631>, accessed 20 May 2025
Copeland, N., ‘“Guatemala will never change”: Radical pessimism and the politics of personal interest in the Western Highlands’, Journal of Latin American Studies, 43/3 (2011), pp. 485–515, <https://doi.org/10.1017/S0022216X11000411>
Council on Foreign Relations, ‘The Sunni-Shia divide’, 27 April 2023, <https://www.cfr.org/article/sunni-shia-divide>, accessed 25 September 2025
Crowley, M., ‘Trump’s false election fraud claims split Republicans’, The New York Times, 6 November 2020, <https://www.nytimes.com/2020/11/06/us/politics/trump-election-republicans.html>, accessed 22 May 2025
Day, J., ‘Everyday practices of toleration: The interfaith foundations of peace accords in Sierra Leone’, Politics and Religion, 14/1 (2020), pp. 54–82, <https://doi.org/10.1017/S1755048319000555>
DeSmith, C., ‘Economic prospects brighten for children of low-income Black Americans, study finds’, Harvard Gazette, 31 July 2024, <https://news.harvard.edu/gazette/story/2024/07/economic-mobility-up-for-black-americans-born-poor-study-finds>, accessed 22 May 2025
Drazanova, L., ‘Historical index of ethnic fractionalization dataset (HIEF)’, Harvard Dataverse, 2019, <https://doi.org/10.7910/DVN/4JQRCL>
Farooqui, A., ‘Political representation of a minority: Muslim representation in contemporary India’, India Review, 19/2 (2020), pp. 153–75, <https://doi.org/10.1080/14736489.2020.1744996>
Fiorina, M. P. and Abrams, S. J., ‘Political polarization in the American public’, Annual Review of Political Science, 11 (2008), pp. 563–88, <https://doi.org/10.1146/annurev.polisci.11.053106.153836>
Georgetown Institute for Women, Peace and Security (GIWPS) and Peace Research Institute Oslo (PRIO), Women, Peace, and Security Index 2023/24: Tracking Sustainable Peace through Inclusion, Justice, and Security for Women (Washington, DC: GIWPS and PRIO, 2023), <https://giwps.georgetown.edu/wp-content/uploads/2023/10/WPS-Index-full-report.pdf>, accessed 25 September 2025
Hall, S., Policing the Crisis: Mugging, the State, and Law and Order (London and Basingstoke: The MacMillan Press, 1978), <https://sociologytwynham.com/wp-content/uploads/2014/10/policing-the-crisis.pdf>, accessed 25 September 2025
Harell, A. and Stolle, D., ‘Diversity and democratic politics: An introduction’, Canadian Journal of Political Science, 43/2 (2010), pp. 235–56, <https://doi.org/10.1017/S000842391000003X>
Harris, B. and Ingizza, C., ‘How Lula’s government plans to boost racial equality in Brazil’, Financial Times, 8 February 2023, <https://www.ft.com/content/811fff50-a001-48fe-b42b-f84a3118a3bb>, accessed 29 September 2025
Heath, O. and Tillin, L., ‘Institutional performance and vote buying in India’, Studies in Comparative International Development, 53 (2018), pp. 90–110, <https://doi.org/10.1007/s12116-017-9254-x>
Houle, C. and Conroy-Krutz, J., ‘Colonial mapmaking, ethnic identity, and traditional authority in Africa’, British Journal of Political Science, 55 (2025), <https://doi.org/10.1017/S0007123424000759>
Hsu, J., ‘Partisan perceptions and sentiment measurement’, Surveys of Consumers, University of Michigan, 11 April 2025, <https://data.sca.isr.umich.edu/fetchdoc.php?docid=78605>, accessed 29 September 2025
Ikawa, D., ‘Building pluralism through affirmative action in Brazil: The case of education’, Global Centre for Pluralism, March 2017, <https://www.pluralism.ca/press-release/building-pluralism-affirmative-action-brazil-case-education>, accessed 22 May 2025
International IDEA, Global State of Democracy Indices, [n.d.a], <https://www.idea.int/democracytracker/gsod-indices>, accessed 22 May 2025
—, Voter Turnout Database, [n.d.b], <https://www.idea.int/data-tools/data/voter-turnout-database>, accessed 30 October 2025
—, Democracy Tracker, ‘Sierra Leone - January 2024’, 2024a, <https://www.idea.int/democracytracker/report/sierra-leone/january-2024>, accessed 20 May 2025
—, Perceptions of Democracy: A Survey about How People Assess Democracy around the World (Stockholm: International IDEA, 2024b), <https://www.idea.int/publications/catalogue/perceptions-of-democracy-survey>, accessed 20 May 2025
—, Democracy Tracker, ‘Brazil’, 2025a, <https://www.idea.int/democracytracker/country/brazil>, accessed 25 September 2025
—, Democracy Tracker, ‘Colombia’, 2025b, <https://www.idea.int/democracytracker/country/colombia>, accessed 25 September 2025
—, Democracy Tracker, ‘India’, 2025c, <https://www.idea.int/democracytracker/country/india>, accessed 25 September 2025
—, Democracy Tracker, ‘Senegal’, 2025d, <https://www.idea.int/democracytracker/country/senegal>, accessed 20 May 2025
—, Democracy Tracker, ‘Sierra Leone’, 2025e, <https://www.idea.int/democracytracker/country/sierra-leone>, accessed 28 October 2025
—, Democracy Tracker, ‘United States of America’, 2025f, <https://www.idea.int/democracytracker/country/united-states-america>, accessed 25 September 2025
—, The Global State of Democracy 2025: Democracy on the Move (Stockholm: International IDEA, 2025g), <https://doi.org/10.31752/idea.2025.53>
International Monetary Fund (IMF), Sierra Leone: Economic Development Documents—National Development Plan, 2019–23, IMF Country Report No. 19/218 (Washington, DC: IMF, 2019), <https://doi.org/10.5089/9781498324960.002>
Jafri, F. A., Rauniyar, K., Thapa, S., Siddiqui, M. A., Khushi, M. and Naseem, U., ‘CHUNAV: Analyzing Hindi hate speech and targeted groups in Indian election discourse’, ACM Transactions on Asian and Low-Resource Language Information Processing (2024), <https://doi.org/10.1145/3665245>
Jeantet, D. and Savarese, M., ‘Brazil’s voters return Lula to presidency, right-wing Bolsonaro yet to concede’, PBS News, 31 October 2022, <https://www.pbs.org/newshour/world/brazils-voters-return-lula-to-presidency-right-wing-bolsonaro-yet-to-concede>, accessed 20 May 2025
Johnston, R., Manley, D. and Jones, K., ‘Spatial polarization of presidential voting in the United States, 1992–2012: The “Big Sort” revisited’, Annals of the American Association of Geographers, 106/5 (2016), pp. 1047–62, <https://doi.org/10.1080/24694452.2016.1191991>
Jones, M., ‘Sierra Leone coup attempt: What may have sparked the violence’, BBC News, 28 November 2023, <https://www.bbc.com/news/world-africa-67541285>, accessed 20 May 2025
Kallon, E. V. N., ‘Youth displacement, peacebuilding, and ethnoregional-neopatrimonial politics: The case of post-war Sierra Leone’, ASC-TUFS Working Papers, 1 (2021), pp. 65–93, <https://www.tufs.ac.jp/asc/ASC-TUFS_WP_01_065-093kallon_web.pdf>, accessed 29 September 2025
Keefer, P., ‘Clientelism, credibility, and the policy choices of young democracies’, American Journal of Political Science, 51/4 (2007), pp. 804–21, <https://doi.org/10.1111/j.1540-5907.2007.00282.x>
Keefer, P. and Vlaicu, R., ‘Democracy, credibility, and clientelism’, Journal of Law, Economics, and Organization, 24/2 (2008), pp. 371–406, <https://doi.org/10.1093/jleo/ewm054>
Khan, M. K., ‘Securing minority rights for Muslims in India: A comprehensive exploration of challenges and prospects’, Contemporary Journal of Social Science Review, 2/4 (2024), pp. 147–54, <https://contemporaryjournal.com/index.php/14/article/view/45>, accessed 20 May 2025
Kuk, J., Hajnal, Z. and Lajevardi, N., ‘A disproportionate burden: Strict voter identification laws and minority turnout’, Politics, Groups, and Identities, 10/1 (2022), pp. 126–34, <https://doi.org/10.1080/21565503.2020.1773280>
Kumari, S. S., Kihara, A., Sohail, R., Majid, H., Gemzell-Danielsson, K. and Benagiano, G., ‘Preventing gender-based violence: A global imperative’, International Journal of Gynecology and Obstetrics, 169/3 (2025), pp. 1133–39, <https://doi.org/10.1002/ijgo.70086>
Laurent, V., ‘Multiculturalism in Colombia: Twenty-five years of experience’, Global Centre for Pluralism, January 2018, <https://www.pluralism.ca/press-release/multiculturalism-colombia-twenty-five-years-experience>, accessed 22 May 2025
Lavali, A. and M’Cormack-Hale, F., ‘Ahead of Election, Should Sierra Leoneans Be Worried about Social Cohesion?’, Afrobarometer Dispatch No. 619, 23 March 2022, <https://www.afrobarometer.org/wp-content/uploads/2023/03/AD619-Ahead-of-election-should-Sierra-Leoneans-be-worried-about-social-cohesion-Afrobarometer-23march23-1.pdf>, accessed 29 September 2025
Lichter, D. T. and Ziliak, J. P., ‘The rural-urban interface: New patterns of spatial interdependence and inequality in America’, The Annals of the American Academy of Political and Social Science, 672/1 (2017), pp. 6–25, <https://doi.org/10.1177/0002716217714180>
Llaneras, K., Andrino, B. and Pires, L., ‘Resultado de las elecciones en Colombia por municipio en la segunda vuelta’ [Results of the Colombian elections by municipality in the second round], El País, 19 June 2022, <https://elpais.com/america-colombia/elecciones-presidenciales/2022-06-19/resultado-de-las-elecciones-en-colombia-por-municipio-en-la-segunda-vuelta.html>, accessed 20 May 2025
Maizland, L., ‘India’s Muslims: An increasingly marginalized population’, Council on Foreign Relations, 18 March 2024, <https://www.cfr.org/backgrounder/india-muslims-marginalized-population-bjp-modi>, accessed 20 May 2025
Mammone, C., ‘Youth, empowerment and long-term peace consolidation: The case of Sierra Leone’, Social Alternatives, 42/1 (2023), pp. 15–21, <https://search.informit.org/doi/abs/10.3316/informit.181473786301051>, accessed 22 May 2025
Manna, S., Singh, D., Barik, M., Rehman, T., Ghosal, S., Kanungo, S. and Pati, S., ‘Prevalence of intimate partner violence among Indian women and their determinants: A cross-sectional study from national family health survey – 5’, BMC Women’s Health, 24/363 (2024), <https://doi.org/10.1186/s12905-024-03204-x>
Martin, N. S. and Blinder, S., ‘Biases at the ballot box: How multiple forms of voter discrimination impede the descriptive and substantive representation of ethnic minority groups’, Political Behavior, 43/4 (2021), pp. 1487–510, <https://doi.org/10.1007/s11109-020-09596-4>
Mauk, M., ‘Electoral integrity matters: How electoral process conditions the relationship between political losing and political trust’, Quality & Quantity, 56/3 (2022), pp. 1709–28, <https://doi.org/10.1007/s11135-020-01050-1>
Mehrotra, K. and Shih, G., ‘India’s low-caste voters humbled its powerful prime minister’, The Washington Post, 5 June 2024, <https://www.washingtonpost.com/world/2024/06/05/india-election-modi-bjp-dalits>, accessed 25 September 2025
Mettler, S. and Brown, T., ‘The growing rural–urban political divide and democratic vulnerability’, The ANNALS of the American Academy of Political and Social Science, 699/1 (2022), pp. 130–42, <https://doi.org/10.1177/00027162211070061>
Miklos, M. and Bueno, S., ‘The alarming rise of gender-based violence in Brazil’, Americas Quarterly, 27 May 2025, <https://www.americasquarterly.org/article/the-alarming-rise-of-gender-based-violence-in-brazil>, accessed 25 September 2025
Milanovic, B., ‘Global income inequality: Time to revise the elephant’, Social Europe, 5 December 2022, <https://www.socialeurope.eu/global-income-inequality-time-to-revise-the-elephant>, accessed 20 May 2025
Molina, F. R., ‘The Brazilian partisan divide: How the haves and have-nots will vote in the presidential election’, El País, 2 October 2022, <https://english.elpais.com/international/2022-10-02/the-brazilian-partisan-divide-who-will-women-university-students-blacks-and-the-wealthy-vote-for-president.html>, accessed 20 May 2025
Moya, A. and Carter, M., ‘Violence and the Formation of Hopelessness and Pessimistic Prospects of Upward Mobility in Colombia’, National Bureau of Economic Research, Working Paper 20463, September 2014, revised February 2018, <https://doi.org/10.3386/w20463>
Newport, F., ‘Religious group voting and the 2020 election’, Gallup, 13 November 2020, <https://news.gallup.com/opinion/polling-matters/324410/religious-group-voting-2020-election.aspx>, accessed 20 May 2025
Pew Research Center, ‘Party identification among religious groups and religiously unaffiliated voters’, 9 April 2024, <https://www.pewresearch.org/politics/2024/04/09/party-identification-among-religious-groups-and-religiously-unaffiliated-voters>, accessed 20 May 2025
Press Trust of India, ‘Hinduism not a religion but a way of life: PM Narendra Modi’, NDTV, 17 April 2015, <https://www.ndtv.com/india-news/hinduism-not-a-religion-but-a-way-of-life-pm-narendra-modi-755705>, accessed 18 October 2025
Public Religion Research Institute (PRRI), ‘One Leader Under God: The Connection Between Authoritarianism and Christian Nationalism in America – Findings from the 2024 Religion and Authoritarianism Survey’, 10 September 2024, <https://www.prri.org/research/one-leader-under-god-the-connection-between-authoritarianism-and-christian-nationalism-in-america>, accessed 20 May 2025
Richani, N., ‘The political economy of violence: The war-system in Colombia’, Journal of Interamerican Studies and World Affairs, 39/2 (1997), pp. 37–81, <https://doi.org/10.2307/166511>
Romano, A., ‘Poll: Republicans reverse views on economy and election fraud after Trump’s win; much smaller shifts among Democrats’, Yahoo News, 22 November 2024, <https://www.yahoo.com/news/poll-republicans-reverse-views-on-economy-and-election-fraud-after-trumps-win-much-smaller-shifts-among-democrats-185428651.html>, accessed 20 May 2025
Runey, M., ‘Populist parties and their voters: A PODS analytical brief’, International IDEA, 31 July 2024, <https://www.idea.int/blog/populist-parties-and-their-voters-pods-analytical-brief>, accessed 20 May 2025
Schaller, T. F., ‘Why rural white Americans’ resentment is a threat to democracy’, The Conversation, 4 April 2024, <https://doi.org/10.64628/AAI.teaewhymu>
Schwartzman, L. F., ‘Colour violence, deadly geographies, and the meanings of “race” in Brazil’, Ethnic and Racial Studies, 43/6 (2020), pp. 950–75, <https://doi.org/10.1080/01419870.2019.1628287>
Simonsen, K. B., ‘Politics feeds back: The minority/majority turnout gap and citizenship in anti-immigrant times’, Perspectives on Politics, 19/2 (2021), pp. 406–21, <https://doi.org/10.1017/S1537592720002431>
Stewart, E., ‘Not religious, not voting? The “nones” are a powerful force in politics – but not yet a coalition’, The Conversation, 6 September 2023, <https://doi.org/10.64628/AAI.m3s4wvhnc>
Stewart, F., ‘Horizontal Inequalities: Barriers to Pluralism’, Global Centre for Pluralism, March 2017, <https://www.pluralism.ca/wp-content/uploads/2017/12/FrancesStewart_HorizontalInequalities_EN.pdf>, accessed 20 May 2025
Stockemer, D., ‘What affects voter turnout? A review article/meta-analysis of aggregate research’, Government and Opposition, 52/4 (2016), pp. 698–722, <https://doi.org/10.1017/gov.2016.30>
Swamy, A., ‘Plurality under BJP dominance’, East Asia Forum, 3 June 2024, <https://doi.org/10.59425/eabc.1717452000>
Thomas, A. R., ‘Ethnic politics and chieftaincy struggle in Sierra Leone: A threat to national unity’, The Sierra Leone Telegraph, 27 February 2025, <https://www.thesierraleonetelegraph.com/ethnic-politics-and-chieftaincy-struggle-in-sierra-leone-a-threat-to-national-unity>, accessed 20 May 2025
Thompson, L., ‘In Sierra Leone, Perceived Corruption Rises, Public Trust and Leaders’ Job Approval Drop’, Afrobarometer Dispatch No. 106, 29 June 2016, <https://www.afrobarometer.org/wp-content/uploads/migrated/files/publications/Dispatches/ab_dispatchno103_corruption-trust-performance.pdf>, accessed 25 September 2025
United Nations Development Programme (UNDP), Human Development Index—India, 2022, <https://www.undp.org/india/human-development-index-india>, accessed 22 May 2025
United Nations General Assembly, ‘Report of the Special Rapporteur on Freedom of Religion or Belief: Mission to Sierra Leone’, A/HRC/25/58/Add.1, 23 December 2013, <https://docs.un.org/en/A/HRC/25/58/Add.1>, accessed 22 May 2025
United Nations Human Settlements Programme (UN Habitat), ‘Senegal 2023: A Better Quality of Life for All in an Urbanizing World’, Country Brief, 2023, <https://unhabitat.org/sites/default/files/2023/07/senegal_country_brief_final_en.pdf>, accessed 25 September 2025
United Nations Office of the High Commissioner for Human Rights (OHCHR), ‘Statement at the Conclusion of the Visit to Sierra Leone by the Special Rapporteur on Freedom of Religion or Belief, Mr. Heiner Bielefeldt 5 July 2013’, 5 July 2013, <https://www.ohchr.org/en/statements-and-speeches/2013/07/statement-conclusion-visit-sierra-leone-special-rapporteur-freedom>, accessed 22 May 2025
United Nations Population Fund (UNFPA), Prevalence Rates, Trends and Disparities in Intimate Partner Violence: Power of Data in the IPV Geospatial Dashboard (New York: UNFPA, 2021), <https://www.unfpa.org/sites/default/files/resource-pdf/IPVDataAnalysisReport_final.pdf>, accessed 25 September 2025
United Nations Programme for Gender Equality and the Empowerment of Women (UN Women), ‘Senegal’, [n.d.], <https://data.unwomen.org/country/senegal>, accessed 25 September 2025
United States Department of Justice, Office for Access to Justice, ‘Fact Sheet: Access to Justice Is Rural Access’, 20 February 2025, <https://www.justice.gov/atj/fact-sheet-access-justice-rural-access>, accessed 22 May 2025
United States Department of State, ‘2023 Report on International Religious Freedom: Sierra Leone’, 26 June 2024, <https://www.state.gov/reports/2023-report-on-international-religious-freedom/sierra-leone>, accessed 22 May 2025
Uprimny, R., ‘The recent transformation of constitutional law in Latin America: Trends and challenges’, Texas Law Review, 89 (2011), pp. 1587–609, <https://corteidh.or.cr/tablas/r27168.pdf>, accessed 25 September 2025
Vaishnav, M., ‘Modi prioritised Hindu majoritarianism over economy’, Carnegie Endowment for International Peace, 7 February 2020, <https://carnegieendowment.org/posts/2020/02/modi-prioritised-hindu-majoritarianism-over-economy?lang=en>, accessed 22 May 2025
—, ‘Legislative capture in India: Is democracy back from the brink?’, The ANNALS of the American Academy of Political and Social Science, 712/1 (2024), pp. 61–76, <https://doi.org/10.1177/00027162241307742>
Varshney, A. and Staggs, C., ‘Hindu nationalism and the new Jim Crow’, Journal of Democracy, 35/1 (2024), pp. 5–18, <https://doi.org/10.1353/jod.2024.a915345>
Waughray, A., Capturing Caste in Law: The Legal Regulation of Caste Discrimination (London: Routledge, 2022), <https://doi.org/10.4324/9781315750934>
Weber, A., Hiers, W. and Flesken, A., Politicized Ethnicity: A Comparative Perspective (New York: Palgrave Macmillan, 2016), <https://doi.org/10.1057/9781137349453>
World Bank, Data Portal, ‘Intentional homicides (per 100,000 people) – Brazil, Colombia’, [n.d.], <https://data.worldbank.org/indicator/VC.IHR.PSRC.P5?locations=BR-CO>, accessed 25 September 2025
Wu, C., Wilkes, R. and Wilson, D. C., ‘Race and political trust: Justice as a unifying influence on political trust’, Daedalus, 151/4 (2022), pp. 177–99, <https://doi.org/10.1162/daed_a_01950>
Yeboah, E., ‘Briefing Paper: Senegal’s Electoral and Political Environment Ahead of the February 25, 2024 Elections’, West Africa Democracy Solidarity Network, February 2024, <https://wademosnetwork.org/2024/02/briefing-paper-senegals-electoral-and-political-environment-ahead-of-the-february-25-2024-elections>, accessed 20 May 2025
| Cleavage | A division in a society of social groups according to political interests or priorities. |
| Ethnicity | A common ancestry that can be based variably in cultural traits or habits, shared historical experience, or past or current religious, linguistic or other collective practice. |
| Race | A group defined, either by itself or by others, by perceived common physical traits or characteristics. |
| Social class | The hierarchical division of a society into groups, commonly understood to be related to, but not extricable from, economic status. |
| Pluralism | The view that representation and political power should be evenly distributed between a country’s different social groups. |
| Polarization | The division of a society into sharply divided camps on matters of politics or policy. |
In addition to the points raised in the methodological summary in the Introduction, readers may wish to know further details about sample sizes, survey dates, methods of contact, participation incentives and the margin of error for each country.
Our goal for sampling was to have 1,000 people from a nationally representative sample and an additional sample of 500 people whose household income indicated that their family was experiencing poverty. The World Bank’s definition of an international poverty line (USD 2.15 per day) served as an initial guide, but we defined the income threshold differently for each country on the basis of local income distributions. In Italy and Lithuania, for example, we defined the threshold in the low-income oversample to be a household income below EUR 20,000 (approximately USD 23,000), whereas the threshold for Senegal was XOF 1.2 million (approximately USD 2,100). In most countries, we were able to get a sample of the type and size that we planned. In Brazil, however, we were not able to recruit as large a sample as planned.
For the online surveys completed by YouGov, we used the company’s existing panels. Participants opted in to participate in those panels; they were not randomly selected. This means that the margin of error reported in Table A.1 below is only indicative. The real margin of error could be higher because the sample was not random. Participants in the YouGov panel were compensated for their time in the form of points that can be redeemed for rewards through a system administered by YouGov. In the telephone surveys (technically computer-assisted telephone interviews), respondents were contacted through random dialling. They were compensated for their time in the form of airtime credits.
In most countries, we were able to achieve a nationally representative sample, whereas the samples for Colombia and India were online representative. In the countries where data collection was curtailed the sample is not fully balanced. In our analysis, however, we do not report the frequencies of responses across the sample. Instead, we weight each respondent and report the weighted frequencies of responses for each question. The two survey providers applied different weighting schemes. For the countries surveyed by YouGov, the data were weighted by age, voter turnout, vote choice, gender, education and income. In the countries surveyed by GeoPoll, on the other hand, the data were weighted by age, gender and region.
| Country | Method | Data collection dates | Sample type | Sample size | Margin of error |
|---|---|---|---|---|---|
| Brazil | Telephone | 27 July 2023 to 6 November 2023 | Nationally representative | 1,259 | 3% |
| Colombia | Internet | 28 July 2023 to 30 August 2023 | Online representative | 1,500 | 3% |
| India | Internet | 4 January 2024 to 16 January 2024 | Online representative | 1,500 | 3% |
| Senegal | Telephone | 28 July 2023 to 20 August 2023 | Nationally representative | 1,598 | 2% |
| Sierra Leone | Telephone | 27 July 2023 to 17 October 2023 | Nationally representative | 1,632 | 2% |
| United States | Internet | 11 December 2023 to 19 December 2023 | Nationally representative | 1,500 | 3% |
This illustration shows the key takeaways and discussion of the pre-launch event for the second report in the Perceptions of Democracy Survey (PODS) series on 27 November 2025. The illustration was drawn in real time by Leah Sands (Public Cinema).
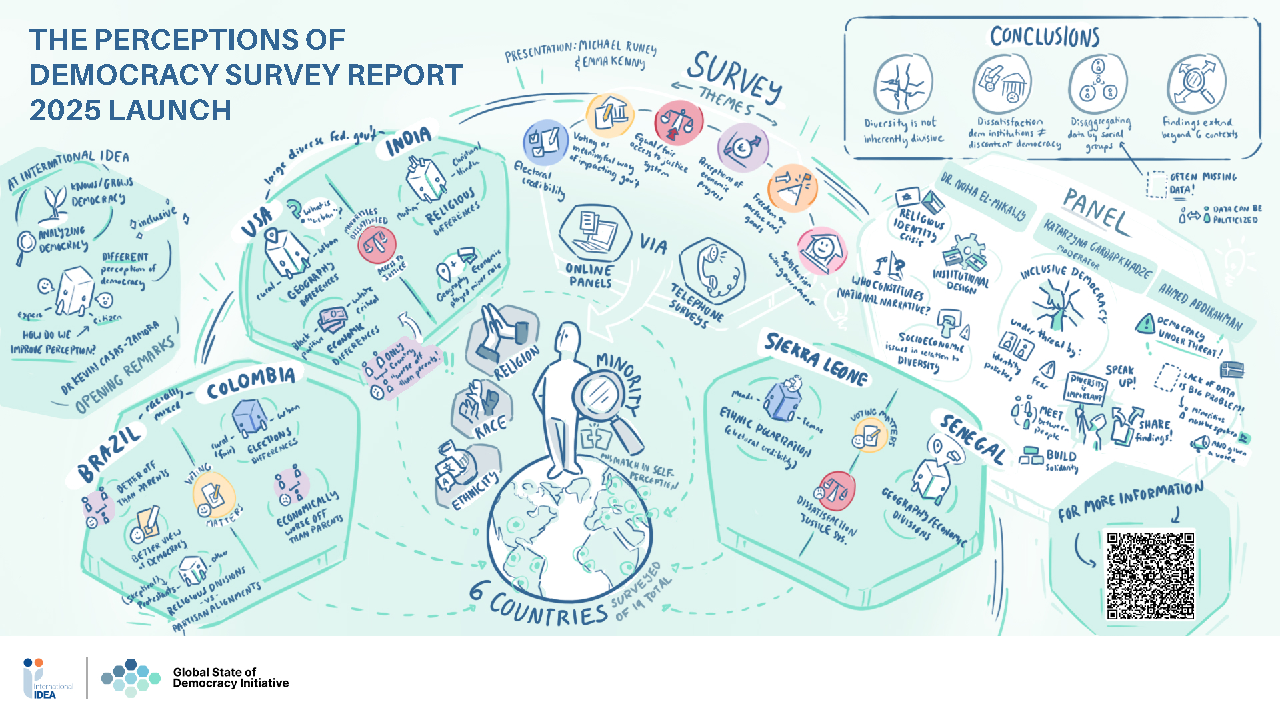
Michael Runey is an Adviser in the Democracy Assessment Unit. His work at International IDEA includes qualitative and quantitative analysis for the Global State of Democracy (GSoD) initiative, the Perceptions of Democracy Survey (PODS) project, the Democracy Tracker, and foresight and futures programmes in Asia and the Pacific. He was previously the coordinator for the SDG16 Data Initiative.
Prior to joining International IDEA, Michael worked in human rights, journalism and community development. He has extensive experience with human rights and democracy issues in Eurasia, and has worked for Transparency International in Ukraine, Meydan TV (Azerbaijan), Global Witness and Civil Rights Defenders.
Emma Kenny is an Associate Programme Officer of the Democracy Assessment Unit. Her work focuses on providing research, analysis and communications support for the GSoD initiative. Her research is principally focused on democracy and human rights in the Asia and the Pacific Region.
Prior to joining International IDEA, Emma served as a Research Coordinator and Research Assistant to the Program on Gender, Rights and Resilience at the Harvard Humanitarian Initiative. Emma is a Swedish Fulbright scholar-recipient alum with an MA in International Affairs from Northeastern University in Boston, United States.
- PODS respondents were presented with choices for religious affiliation and membership in a racial or ethnic group that were tailored to each country. The available options were based on census or otherwise equivalent official or authoritative data. Although caste may be a relevant social category in several of the countries addressed in this report, it is not included in the PODS data set and is consequently not addressed in this report.
- An asterisk indicates that the PODS data set does not have a sufficiently large representative sample for this group, and it is therefore not included in the analysis. Two asterisks indicates that this demographic division is not discussed due to the lack of a statistically significant difference in response patterns.
- The nature of the sample varied slightly from country to country. In 16 of the 19 countries, the main sample (1,000 people) was nationally representative. In Colombia and India, the sample was online representative.
- When averaging responses to produce a mean variable in this manner, the response ‘I don’t know’ was excluded unless otherwise specified.
- To paraphrase Stuart Hall’s quotation from the Introduction, we could say that in Sierra Leone ethnicity is the modality in which class is lived.
- The differences between the responses of the Wolof and other Senegalese minority groups did not pass a test for statistical significance.
- The survey includes geographical data for all respondents, who are categorized as either urban (city), suburban, town-dwelling or rural. In several cases, however, there was an insufficient number of respondents in a certain category—Brazil (rural), Colombia (suburban) and Sierra Leone (suburban).
- The election in question took place in 2020, not 2024.
- The survey did not capture a sufficient number of Hindu, Jewish or Muslim Americans as defined by this analysis
(n > 50). - Due to India’s vast ethnic diversity, this report examines ethnicity at the level of much broader linguistic groups rather than individual ethnic groups.
- The discrepancy in responses reflects the differing perceptions of minorities as a whole versus the perceptions of individual minority groups, with some groups excluded due to the small sample size.
- This effect is also visible in other PODS countries, such as the USA, where the perceptions of self-identified minorities as a whole are slightly different compared with those of disaggregated minorities.
- While Brazil is frequently thought of as a relatively violent country in global comparison, homicide rates in Colombia were two to three times higher throughout much of the 1980s and 1990s. Rates of violence in these two countries have been comparable only since 2014 (World Bank n.d.).
- Respondents were also asked whether they personally voted in the most recent election, and in no country were there statistically significant differences in the responses of the social groups analysed here.
Abbreviations
| APC | All People’s Congress |
|---|---|
| BJP | Bharatiya Janata Party |
| GSoD | Global State of Democracy |
| PODS | Perceptions of Democracy Survey |
| SLPP | Sierra Leone People’s Party |
This report was written by Michael Runey and Emma Kenny, with oversight from Alexander Hudson, Katarzyna Gardapkhadze and Seema Shah.
We are indebted to Daniela Dominguez, Alexander Hudson and Joseph Noonan for their assistance with data cleaning and analysis. Emily Bloom and Irene Postigo Sanchez provided invaluable fact-checking. We thank Emily Bloom for her support with the graphs. Lisa Hagman oversaw the publication process.
© 2025 International Institute for Democracy and Electoral Assistance
International IDEA publications are independent of specific national or political interests. Views expressed in this publication do not necessarily represent the views of International IDEA, its Board or its Council members.
With the exception of any third-party images and photos, the electronic version of this publication is available under a Creative Commons Attribution-NonCommercial-ShareAlike 4.0 (CC BY-NC-SA 4.0) licence. You are free to copy, distribute and transmit the publication as well as to remix and adapt it, provided it is only for non-commercial purposes, that you appropriately attribute the publication, and that you distribute it under an identical licence. For more information visit the Creative Commons website: <http://creativecommons.org/licenses/by-nc-sa/4.0>.
Design and layout: International IDEA
Cover illustration: Diella Valla, all rights reserved. Image on page 10 by Naledi Modupi, all rights reserved. Image in Annex C was drawn in real time by Leah Sands (Public Cinema).
DOI: <https://doi.org/10.31752/idea.2025.95>
ISBN: 978-91-8137-073-7 (HTML)
ISBN: 978-91-8137-072-0 (PDF)