
The Global State of Democracy Indices: Technical Procedures Guide
Version 9 (2025)
The Global State of Democracy Indices: Technical Procedures Guide, Version 9 is the third in a set of documents prepared by International IDEA to present the Global State of Democracy (GSoD) Indices. It outlines the technical aspects of constructing the Indices, and complements The Global State of Democracy Indices Methodology: Conceptualization and Measurement Framework, Version 9 (Skaaning and Hudson 2025), which presents the theoretical framework that guided the construction of the Indices, and The Global State of Democracy Indices Codebook, Version 9 (Tufis and Hudson 2025), which presents information about the data set, including variables, attributes of democracy, subattributes, subcomponents and indicators.
The GSoD Indices depict democratic trends at the country, regional and global levels across a broad range of different attributes of democracy in the period 1975–2024 but do not provide a single index of democracy. The Indices produce data for 174 countries. The data underlying the Indices is based on 154 indicators developed by various scholars and organizations using different types of sources, including expert surveys, standards-based coding by research groups and analysts, observational data and composite measures.
The Global State of Democracy is a report that aims to provide policymakers with an evidence-based analysis of the state of global democracy, supported by the GSoD Indices, in order to inform policy interventions and identify problem-solving approaches to trends affecting the quality of democracy around the world.
The full publication, as well as the GSoD Indices Database, can be accessed online:
<https://www.idea.int/gsod>
This Guide outlines the process of constructing the Global State of Democracy (GSoD) Indices, which inform the annual Global State of Democracy Reports. It is written for readers who want a better understanding of the Indices, as well as researchers who may wish to use and build on the data contained within them. This Guide builds upon the GSoD Indices Methodology. For a detailed outline of the conceptual and measurement framework see The Global State of Democracy Indices Methodology: Conceptualization and Measurement Framework, Version 9 (2025) (Skaaning and Hudson 2025).
For each component of the construction of the GSoD Indices, the Guide provides information about the procedures followed, outlined in a step-by-step description to allow the interested reader to understand the research process. The eight steps can be summarized as follows:
- Identifying the data sources (see Chapter 1).
- Preparing the data sources for merger (see Chapter 2).
- Preparing the indicators for aggregation (see Chapter 3).
- Assessing the unidimensionality of the Indices (see Chapter 4).
- Aggregating the indicators into Indices (see Chapter 5).
- Scaling the Indices (see Chapter 6).
- Computing the confidence intervals (see Chapter 7).
- Conducting validity checks (see Chapter 8).
After a brief description of the theoretical structure that guided this project, the Guide presents the data sources, the coverage of the data set, the indicators used to construct the main attributes and subattributes of democracy, the procedures used to compute these attributes and the structure of the complete data set.
Background
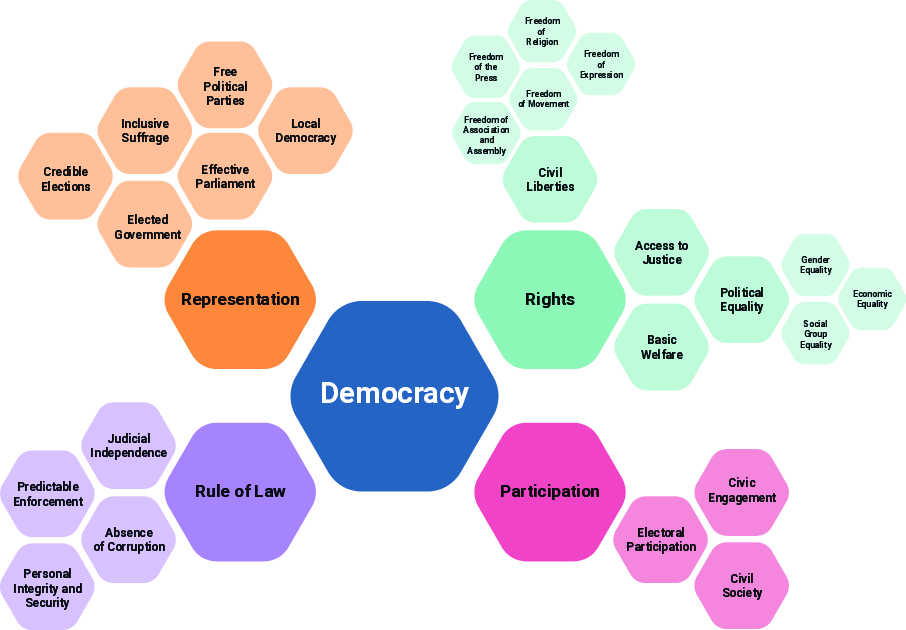
The main objective of the GSoD Indices is to identify systematic data that captures trends at the global, regional and national levels for different aspects of International IDEA’s comprehensive understanding of democracy. The Indices turn a broad range of empirical indicators from various data sets into measures of different aspects (attributes, and subattributes; see Figure I.1) of democracy that can be used to evaluate the state of democracy at the global, regional and national levels. The Indices can also help stakeholders, such as policymakers, researchers and civil society actors, in their analysis of trends related to different aspects of democracy and to identify priority policy areas. The Global State of Democracy 2023: The New Checks and Balances (International IDEA 2023) is an example of how the GSoD Indices can be used to track trends in democratic development. Version 9 of the GSoD Indices (2025) covers 174 independent countries in the period 1975–2024. The Indices are composite measures based on 154 indicators from different kinds of extant data sources. These indicators are assigned to the different subattributes in the conceptual framework and combined into the GSoD Indices using either item response theory (IRT) modelling, Bayesian factor analysis (BFA) or mathematical operations such as multiplication and averaging. A key feature of the methodology is that it generates uncertainty estimates for most of the Indices, which allows users of the data set to assess whether the differences in scores over time and across countries are significant.
The GSoD Indices were produced by a team of International IDEA staff and two external experts. The initial design of the Indices was supervised by an Expert Advisory Board consisting of five leading experts in the field of democracy measurement. To ensure consistency, transparency and high levels of measurement validity and reliability, careful justification and documentation of the conceptual distinctions and methodological choices made, and the use of state-of-the-art procedures were emphasized at all stages of the construction of the Indices.
Conceptual structure
The GSoD Indices build on an elaborate conceptual framework that is rooted in International IDEA’s State of Democracy (SoD) Assessment Framework (Beetham et al. 2008). The SoD Assessment Framework is defined by two principles (popular control and political equality), seven mediating values (participation, authorization, representation, accountability, transparency, responsiveness and solidarity), and four pillars (citizens, law and rights; representative and accountable government; civil society and popular participation; and democracy beyond the state). For more details, see the SoD Assessment Framework (Beetham et al. 2008) and the GSoD Indices Methodology (Skaaning and Hudson 2025). The democratic principles underpinning the SoD framework—popular control and political equality—are also at the core of the GSoD Indices. In order to construct the GSoD Indices, however, the SoD conceptual framework was modified to transform it into a systematic, cross-national and cross-temporal quantitative measurement tool (Skaaning and Hudson 2025).
The GSoD Indices aim to capture the extent to which (a) there is effective popular control over public decision makers, or vertical accountability; (b) citizens have politically relevant freedoms and power resources; (c) executive power is checked effectively by other powers, or horizontal accountability; (d) public authorities are impartial and predictable in implementing the law; and (e) people have and make use of various opportunities for political participation at different levels (Skaaning and Hudson 2025).
The GSoD data set therefore contains separate, fine-grained Indices related to four attributes of democracy (see Beetham 1999: 154–57; Beetham et al. 2008: 27–28):
- Representation (free and equal access to political power).
- Rights (individual liberties and resources).
- Rule of Law (predictable and equal enforcement of the law, and limitation of government power).
- Participation (instruments for and realization of political involvement).
In addition, the GSoD conceptual framework contains, at lower levels of abstraction, 17 subattributes and an additional 5 subcomponents of Civil Liberties and 3 subcomponents of Political Equality. Figure I.1 presents a schematic overview of the GSoD conceptual framework. Separate GSoD Indices are constructed for each attribute and subattribute (see Table I.1).
| Attribute | Subattribute | Assessment question |
|---|---|---|
| 1. Representation (free and equal access to political power) | 1.1. Credible Elections | To what extent are elections free from irregularities? |
| 1.2. Inclusive Suffrage | To what extent do all adult citizens have voting rights? | |
| 1.3. Free Political Parties | To what extent are political parties free to form and campaign for office? | |
| 1.4. Elected Government | To what extent is access to government determined by elections? | |
| 1.5. Effective Parliament | To what extent does parliament oversee the executive? | |
| 1.6. Local Democracy | To what extent are there freely elected, influential local governments? | |
| 2. Rights (individual liberties and resources) | 2.1. Access to Justice | To what extent is there equal, fair access to justice? |
| 2.2. Civil Liberties | To what extent are civil liberties respected? | |
| 2.3. Basic Welfare | To what extent is there basic welfare? | |
| 2.4. Political Equality | To what extent is there political equality? | |
| 3. Rule of Law (predictable and equal enforcement of the law, and limitation of government power) | 3.1. Judicial Independence | To what extent are the courts independent? |
| 3.2. Absence of Corruption | To what extent is the exercise of public authority free from corruption? | |
| 3.3. Predictable Enforcement | To what extent is the enforcement of public authority predictable? | |
| 3.4. Personal Integrity and Security | To what extent are people free from violence? | |
| 4. Participation (instruments of and for the realization of political involvement) | 4.1. Civil Society | To what extent are civil society organizations free and influential? |
| 4.2. Civic Engagement | To what extent do people participate in civil society organizations? | |
| 4.3. Electoral Participation | To what extent do people participate in national elections? |
International IDEA’s GSoD Indices are composite measures based on 154 indicators collected from 22 different data sets. No original data collection was carried out in connection with the initial construction of the GSoD Indices. However, since 2018, International IDEA has coded new years for several of the data sets that have not been updated by their original authors.
A number of criteria guided the selection of the data sets to be used for collecting the indicators. First, only those data sets that provided transparent and credible information on data-generating processes were selected. Second, data sets were needed with extensive coverage both spatially (at least 130 countries) and temporally (at least 10 years in the period 1975–2024). Third, data sets were also needed that have been and will continue to be updated on a regular basis. Fourth, priority was given to open-access data sets.
Four different types of sources were used to collect data for these data sets:
- Expert surveys (ES), for which country experts generate data based on their assessment of the situation regarding particular issues in a given country.
- Standards-based in-house coding (IC), which is used by researchers to generate data based on an evaluative assessment of country-specific information collected through desk research from various reports, academic publications, reference works or news sources.
- Observational data (OD) on features that are directly observable and do not need the interpretation of experts or researchers, such as infant mortality rates or the representation of women in parliament.
- Composite measures (CM), which generate data based on a number of variables from different existing data sets rather than on original data collection.
For a more detailed discussion of the advantages and disadvantages of the various types of data used see Skaaning and Hudson (2025). Table A.1 (see Annex A) lists the 22 data sets used, the type of data they offer and the number of indicators collected from each of them.
Step 1: Gathering the data sources
The first step was to gather the data sources for use in constructing the GSoD Indices. For each data set, the most recent version of the data was downloaded, together with the corresponding codebook or other supporting documents required to understand the content of the data set.
For the most recent update of the GSoD Indices (v9, 2025), Version 15 of the Varieties of Democracy (V-Dem) data set, released in March 2025, was used. Updated versions of the Civil Liberties Dataset (CLD), the Lexical Index of Electoral Democracy (LIED) and the Media Freedom Dataset were obtained directly from the authors. The International Country Risk Guide (ICRG) data set was purchased. For the remaining 17 data sets (see Table A.1), the versions available online were downloaded during March–May 2025. Since the Polity5 and Political Terror Scale data sets had not been updated by that time, missing scores for 2020 to 2024 (as needed) were added by International IDEA staff and consultants following the coding procedures published by the original authors. A copy of the downloaded data was archived for future reference. The next step in the procedure was to prepare the data to enable the indicators to be consolidated into a single data set.
| Data set | Data provider | Reference |
|---|---|---|
| Bertelsmann Stiftung’s Transformation Index (BTI) | Bertelsmann Stiftung | <https://bti-project.org> |
| Bjørnskov-Rode Regime Data (BRRD) | Bjørnskov and Rode | <http://www.christianbjoernskov.com/bjoernskovrodedata> |
| Child Mortality Estimates (CME) | UN Inter-agency Group for Child Mortality Estimation | <https://childmortality.org> |
| Civil Liberties Dataset (CLD) | Møller and Skaaning | <http://ps.au.dk/forskning/forskningsprojekter/dedere/datasets> |
| Food and Agricultural Organization of the United Nations (FAO) Food Balances | Food and Agricultural Organization of the United Nations (FAO) | <https://www.fao.org/faostat/en/#data/FBS> |
| Freedom in the World | Freedom House | <https://freedomhouse.org/report/freedom-world> |
| Freedom on the Net | Freedom House | <https://freedomhouse.org/report/freedom-net> |
| Global Educational Attainment Distributions | Institute for Health Metrics and Evaluation (IMHE) | <https://ghdx.healthdata.org/record/ihme-data/global-educational-attainment-distributions-1970-2030> |
| Global Findex Database | World Bank | <https://data.worldbank.org/> |
| Global Gender Gap Report | World Economic Forum | <https://www.weforum.org/reports/global-gender-gap-report-2022> |
| Global Health Observatory | World Health Organization (WHO) | <https://www.who.int/data/gho/data/themes/topics/indicator-groups/indicator-group-details/GHO/> |
| Global Media Freedom Dataset (MFD) | Whitten-Woodring and Van Belle | <https://faculty.uml.edu//Jenifer_whittenwoodring/MediaFreedomData_000.aspx> |
| ILOSTAT | International Labour Organization (ILO), Department of Statistics | <https://ilostat.ilo.org/> |
| International Country Risk Guide (ICRG) | Political Risk Services | <http://epub.prsgroup.com/products/icrg> |
| Lexical Index of Electoral Democracy (LIED) | Skaaning, Gerring and Bartusevičius | <http://ps.au.dk/forskning/forskningsprojekter/dedere/datasets> |
| Political Terror Scale (PTS) | Gibney, Cornett, Wood, Haschke, Arnon and Pisanò | <http://www.politicalterrorscale.org> |
| Polity5 | Marshall, Jaggers and Gurr | <http://www.systemicpeace.org/inscrdata.html> |
| Standardized World Income Inequality Database (SWIID) | Solt | <https://fsolt.org/swiid/> |
| United Nations E-Government Survey | UN Department of Economic and Social Affairs | <https://publicadministration.un.org/egovkb/en-us/Reports/UN-E-Government-Survey-2022> |
| Varieties of Democracy data set | V-Dem Project | <https://www.v-dem.net> |
| Voter Turnout Database | International IDEA | <https://www.idea.int/data-tools/data/voter-turnout> |
| World Population Prospects (WPP) | UN Department of Economic and Social Affairs Population Division | <https://population.un.org/wpp> |
The unit of observation for International IDEA’s Global State of Democracy Indices is the country–year. The 2025 release of the data set contains data for 174 countries for up to 50 years, giving a total of 8,176 country–years. Details of the spatial and temporal coverage of the data set are presented in the following sections.
Spatial coverage
International IDEA’s GSoD Indices provide data for almost all the independent countries in the world with a population in 2024 of at least 250,000 people. Countries are included in the data set from 1975 or, if the country was not independent in 1975, the year it gained independence (see Step 2). The data set does not include semi-sovereign units such as Somaliland. Countries that have been dissolved remain in the data set until they cease to exist. Using these inclusion rules, the data set is composed of 174 countries. The only country that has exited the data set is the German Democratic Republic, which was dissolved in 1990 after unification with the Federal Republic of Germany.
A complete list of the 174 countries included in the GSoD Indices data set is provided in Table B.1 (see Annex B).
Temporal coverage
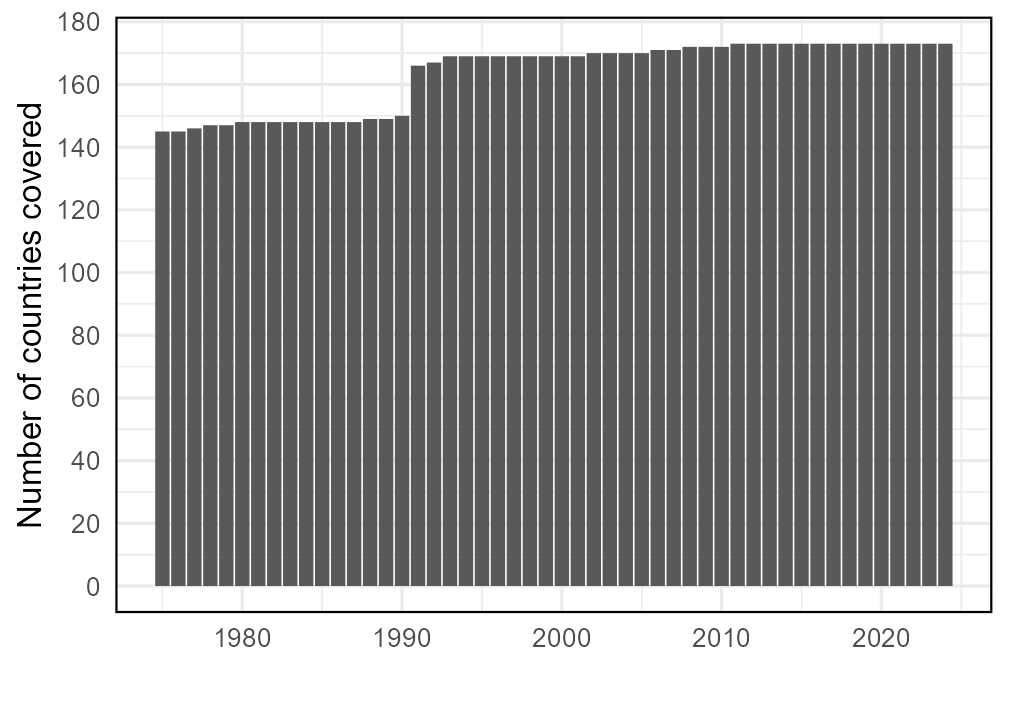
The ninth edition of International IDEA’s GSoD Indices covers the period 1975–2024. The data set covers the period since the International Covenant on Civil and Political Rights and the International Covenant on Economic, Social and Cultural Rights took effect in 1976, using 1975 as a reference point. Moreover, the data set starts with a period that is often referred to as ‘the third wave of democratization’ (Huntington 1991) in the democratization literature.
The number of countries covered each year by the GSoD Indices is shown in Figure 2.1, while Table B.1 (see Annex B) indicates the temporal coverage for each of the 174 countries included in the data set.
Geographical regions
International IDEA’s GSoD Indices also include aggregated values at the regional and subregional levels. The regional definitions follow closely those developed by International IDEA for the Global State of Democracy (see International IDEA 2017), which creates regions based on a geographical criterion while also taking account of the cultural and historical links among countries that belong to the same subregion or region. In total, aggregated values are presented for a total of 5 regions and 18 subregions:
- Africa (East Africa, Central Africa, North Africa, Southern Africa, and West Africa).
- Americas (Caribbean, Central America, Northern America, and South America).
- Asia and the Pacific (Central Asia, East Asia, South Asia, South-East Asia, and Oceania).
- Western Asia.
- Europe (Central Europe, Eastern Europe, Southern Europe, and North/Western Europe).
It should be noted that the values in the data set are aggregated without using population weights. Table B.2 (see Annex B) contains a complete list of the regions and subregions, as well as their membership.
Regional organizations
International IDEA’s GSoD Indices also contain aggregated values for five regional and international organizations: the African Union (AU), the Association of Southeast Asian Nations (ASEAN), the European Union (EU), the Organisation for Economic Co-operation and Development (OECD) and the Organization of American States (OAS).
As in the case of the geographical regions, the values in the data set are aggregated without using population weights. A complete list of the regional organizations and their membership is given in Table C.1 (see Annex C).
Step 2: Preparing the data sources for merger
Once the coverage of the GSoD Indices had been established (174 countries, and the period 1975–2024), the next step was to prepare the various data sources used to be merged into a single data set.
The input data were subsetted to include only the country–years covered by the GSoD Indices. For example, the German Democratic Republic ceased to exist during the covered period so the country–years after its dissolution were deleted. In other cases, such as the former Soviet republics, the countries were formed during the period covered. The country–years before these countries gained independence were therefore deleted. After excluding all these country–years, the country–year matrix contained 8,176 country–years. In all cases, a standard procedure for successor states was used, broadly following the procedures of the Varieties of Democracy project. Czechia is the successor of Czechoslovakia, Russia is the successor of the Soviet Union, Serbia is a successor of Yugoslavia and so on. For a detailed description of this procedure see Coppedge et al. (2016b).
Since the different data sources came in different forms, a common set of identifying variables was created for each of the 22 data sources: the year and a country code. The numeric codes from the Correlates of War (COW code) were used for the country code variable. Some data sources, such as V-Dem, already included this variable but it had to be created for other data sources based on the name or abbreviation of the country. In the final version of the data set, these identifiers are complemented by a country–year variable that was created by concatenating the values from the country-code variable (of between 2 and 920) with the values for the year variable (from 1975 to 2024). This resulted in a country–year variable with a value from 21975 to 9502024, which uniquely identifies each combination of country and year in the data set.
In some cases, the data sources also had to be put into country–year format. The International Country Risk Guide (ICRG) data set, for instance, comes in a wide format that had to be transformed into the long format by transposing the variable years into country–years.
The GSoD Indices data set also includes mean values for geographical regions and subregions, treating them as units within the data set. To facilitate analysis, codes for the regions and subregions were added to the variable indicating the country codes. These are additional to the country codes based on the COW codes. The codes from 971 to 989 were reserved for the geographical subregions, while the codes from 991 to 996 were reserved for the geographical regions and code 999 reserved for the whole world. The same approach was used for the regional organizations included in the data set. Codes 961 to 965 were reserved for them. Unique country–year identifiers were also constructed for these additional regions and regional organizations by concatenating their codes and the years. For more details about the codes reserved for the geographical regions and subregions and for the regional organizations see the GSoD Codebook (Tufis and Hudson 2025).
The GSoD Indices conceptual framework guided the selection of the indicators to be included in the data set. The indicators rely on various types of sources and are collected from extant data sets compiled by different organizations and researchers. The main priority in the selection of indicators was a high level of concept–measure consistency, or the extent to which the indicators really capture the core meaning of the particular concepts in question. In addition, the aim wherever possible was to select multiple indicators for each subattribute—especially where an adequate observable indicator was not available.
Assuming the selection of high-quality indicators, a cumulative approach to measurement generally improves confidence in the scores since it utilizes the combined efforts of various data providers in order to make the resulting measures more nuanced and reliable. The use of different indicators enables the capture of related, but nonetheless distinct, aspects of the features to be measured. It also tends to reduce the influence of idiosyncratic measurement errors associated with individual indicators. Finally, drawing on several indicators makes it possible to assess the level of agreement between indicators and use this information to calculate uncertainty estimates for the Indices (see Pemstein, Meserve and Melton 2010; Fariss 2014).
Each of the 154 indicators selected from the 22 data sources corresponds to one of the subattributes or attributes of democracy developed for International IDEA’s GSoD Indices. Tables in Annex D detail the indicators used in each of the aggregated indices, the sources of these indicators, and the coverage and extent of missingness for each indicator (see Annex D). There is an extensive discussion on the selection of indicators in Skaaning and Hudson (2025), while detailed information on each of the indicators is available in Tufis and Hudson (2025).
Step 3: Preparing the indicators for aggregation
All the indicators selected for inclusion in International IDEA’s GSoD Indices have been put through a process of data cleaning to ensure that the data is correct and follows the country–year format. The GSoD Codebook indicates for each indicator whether it was changed in any way from the original data and, if so, lists the specific changes. Only the types of changes made to prepare the indicators are set out below. These can be grouped into two main categories: (a) recoding the data and (b) interpolation of data.
Different types of recoding procedures were used for different indicators in order to prepare them for calculating the GSoD Indices. First, in some cases, the original data included specific codes for missing values. All the specific codes for missing values were recoded as system missing, indicating that the value for that variable for the particular country–year is not available.
Second, for all those variables that were measured on an interval-level scale and that were aggregated using item response theory (IRT) models, the original variables were recoded into ordinal-level variables. For more details about the aggregating procedures used see Skaaning and Hudson (2025: section 3.4). The recoding was done by grouping the original data into 20 categories, each of five percentiles. In this way, interval-level variables ranging from approximately –3.5 to approximately 3.5 were recoded into ordinal-level variables ranging from 1 (the first category, comprised of the bottom five percentiles) to 20 (the last category, comprised of the top five percentiles).
Third, some indicators had categories with very few cases (country–years). As a general rule, categories with less than 1 per cent of the data were recoded into adjacent categories (see the Codebook). Fourth, in some cases the scale was inverted so that all indicators included in an index run in the same direction, with low values indicating absence or low levels of an attribute and high values indicating presence or high levels of an attribute.
With respect to interpolating the data—that is, replacing missing values with reasonable estimates of values in order to increase the coverage of an indicator—different approaches were used, depending on the characteristics of the specific indicator being analysed.
Two different types of interpolation were used for indicators from data sources that did not code the data every year. For indicators related to electoral processes, the values from the election year were duplicated for the remaining years in the electoral cycle. For instance, the value observed for voter turnout in a particular country in 1976 was used for the remaining years in the electoral cycle, 1977, 1978 and 1979, until a new election was held with a new observed value for voter turnout in 1980. For other indicators, which were measured at various time intervals and where the phenomenon being measured is likely to change only slowly, linear interpolation was used from one measurement to the next, assuming a linear process of change over time. For some other observational indicators (e.g. literacy), where there is a great deal of missing data (for example, one observation every 10 years), Stineman interpolation was used to approximate the missing values between valid observations.
Both this step and the following step translate the theoretical links between the attributes and subattributes, and between the subattributes and indicators, into corresponding aggregation formulas. The GSoD framework is based on the assumption that the more the principles are met, the more democratic a political system is. Thus, the achievement of these principles is not seen as an either/or matter, but as a matter of degree. The choice made of the measurement process—to construct Indices with relative, fine-grained scales and uncertainty estimates but without substantive thresholds—also aligns better with this gradualist perspective than crisp distinctions.
Reflective aggregation models and formative aggregation models were used to combine the various indicators into composite Indices. Where indicators of the theoretical constructs reflected a common underlying variable and/or generally showed very high levels of covariation, aggregation based on item response theory (IRT) models or Bayesian factor analysis (BFA) was used. For a detailed discussion of the distinction between formative and reflective indicators, and for detailed descriptions of the aggregation methods used, see Skaaning and Hudson (2025).
It should be noted that, regardless of the aggregation method used, the goal in all cases was the same: to use the information contained in multiple indicators that are measuring different facets of the same phenomenon to construct an index that measures better than its composing indicators the phenomenon that is to be measured. Both IRT and BFA are data reduction procedures that combine the various interrelated indicators into a single measure.
Many of the selected indicators were expected to cluster in meaningful ways and to tap into a limited number of overarching concepts. These expectations were based on theoretical grounds and because previous dimensionality analyses of these (and related) indicators have shown that many of them are highly correlated and reflect common latent dimensions (see e.g. Skaaning 2009; Møller and Skaaning 2014a, 2014b; Teorell et al. 2016).
Item response theory
IRT modelling was used at the lowest level of aggregation (subattribute or subcomponent level) if there was a significant amount of missing data (more than 5 per cent) in any of the indicators used to reflect the concept in question. This allowed use of multiple indicators of the same latent concept ‘to identify and correct for measurement error, and to quantify confidence in the reliability of our estimates’ (Pemstein et al. 2015: 30). A lack of overlap in the coverage of indicators does not result in missing values in estimates for the affected country–years, as would be the case if using factor analysis. Using full information maximum likelihood IRT models means that all the relevant information from the indicators can be used. The missing data in some indicators are then reflected in the uncertainty estimates, which also reflect the level of agreement between indicator scores, or the extent to which they are correlated. If none of the indicators provides data for a given country–year, no estimate is calculated for this country–year. The mirt package developed by Philip Chalmers (2020) was used to conduct the modelling.
Bayesian factor analysis
If there is virtually perfect overlap in the measures, then BFA becomes a more viable option. Like IRT models, BFA provides point estimates for the latent dimension and confidence intervals, but it does so only for country–years with uniform indicator coverage. BFA was therefore used to combine indicators only if all of them had a low level of missing data. Moreover, when applicable, BFA was used to combine subcomponent scores into subattribute scores, and thereafter subattribute scores into attribute scores (i.e. if the measures were expected to reflect the same latent concept in the framework, and when the indicators/Indices to be aggregated showed very strong correlations). For BFA the MCMCpack package in R was used (Martin, Quinn and Park 2020).
Formative approach
When indicators are understood as constitutive components of the concept of interest, this means that the indicators are not necessarily highly correlated. Here, the use of a formative approach is more plausible. Formative models were used in the GSoD framework when a particular version of the procedure was judged to be more appropriate than purely reflective procedures. Hence, a formative model was used to combine the contestation index with an inclusiveness indicator to create the Representation index, and a formative model was also used to aggregate indicators related to Local Democracy (see Step 5: Aggregating the indicators into Indices).
Step 4: Assessing the unidimensionality of Indices
Aggregating multiple indicators into a single index rests on the assumption that the indicators are interrelated, and that they are measuring different manifestations/forms of the same phenomenon. These assumptions, however, have to be tested and confirmed before proceeding with constructing the Indices. Four different ways were used to test the assumption or verify that the indicators could be combined into Indices.
First, the bivariate correlations among all the indicators included in an index were computed for all the Indices. There was an expectation that all the indicators included in an index would be interrelated (correlated), which indicates that they are measuring some aspect of the phenomenon that the index is supposed to measure. The correlation tables are presented in Annex F. Most of the indicators are highly to very highly correlated with the other indicators belonging to the same index. The correlations usually range from 0.6 to 0.9, and most of them are higher than 0.8. Some indicators display only medium correlations of around 0.4 to 0.5, but these are few in number and there are theoretical reasons for keeping them as part of the construction of the index.
Second, high correlations among the indicators are necessary, but not sufficient for constructing the Indices. Since the goal is to construct one index for each of the main attributes of democracy, the indicators that are included in an index have to be related in such a way that they measure the same attribute (a single factor.) Thus, a number of factor analyses were computed that allow one of up to three factors to be extracted, depending on the number of indicators included in the index. (The results of these analyses are not shown but are available on request). In all cases, the single factor solution was better than possible two- or three-factor solutions, suggesting that the Indices can be reduced to a single dimension.
Third, Bayesian factor analyses were computed, asking for single factor extraction for all the Indices. The results of these analyses (see Annex E) show that the indicators have very high loadings on the Indices to which they belong.
Fourth, for each index the Cronbach’s alpha coefficient was also computed to assess the internal consistency of the indicators as a group. The smallest value recorded for Cronbach’s alpha was 0.717, while 16 of the 28 Indices for which this measure is relevant had a Cronbach’s alpha higher than 0.90. All but two of the values were above the usually accepted threshold of 0.80.
All the results discussed above support the argument that the indicators reflect common latent dimensions where they are expected to do so, which justifies aggregating them into a single index.
As indicated in Chapter 4, two different methods were used to aggregate indicators into Indices—IRT and BFA. The choice between the two methods was determined solely by the proportion of missing values in the indicators included in each index. In the case of the two subattributes that are themselves aggregated from subcomponents (Civil Liberties, and Political Equality) that include indicators, the indicators were first aggregated into the subcomponents and the subcomponents then into subattributes.
When using IRT as an aggregating procedure, the scores were estimated using the mirt package in R. Box 5.1 is an example of the syntax used to estimate the scores. The mirt package gives two estimates for each index—the estimate and its standard error for each country–year that has at least one valid value on the indicators that compose the index. The estimates and their standard errors are saved in an output file and then imported into the data set where they can be used for additional computations if needed.
When using BFA as an aggregating procedure, the scores were estimated using the MCMCpack package in R, more specifically the MCMCfactanal command. Box 5.2 provides an example of the syntax used to estimate the scores. For each index, the MCMCpack package gives two estimates, the estimate and its standard error, for each country–year that has valid values on all the indicators that compose the index. The estimates and their standard errors are saved in an output file and then imported into the data set, where they can be used for additional computations if needed.
The aggregation rules used for each subcomponent, subattribute and attribute computed are shown in Table 5.1.
Box 5.1. Syntax for aggregating indicators into Indices using IRT
# subset the data for input
free_express_input <- working_data %>%
dplyr::select(v_22_01:v_22_11) %>%
filter_all(any_vars(!is.na(.)))
# run the IRT model
free_express_irt <- mirt(free_express_input, 1, itemtype = 'graded', technical = list(NCYCLES = 5000))
# save the scores
free_express_scores <- fscores(free_express_irt, method = 'MAP', full.scores = TRUE, full.scores.SE = TRUE)
Box 5.2. Syntax for aggregating indicators into Indices using BFA
# run the model
civil_lib_bfa <- MCMCfactanal(~ free_express_est + free_press_est + free_assoc_assem_est + free_relig_est + free_move_est,
factors = 1, lambda.constraints = list(), data = civil_lib_vars,
burnin = 5000, mcmc = 100000, thin = 100, verbose = 1000, seed = NA,
lambda.start = NA, psi.start = NA, l0=0, L0=0, a0=0.001, b0=0.001,
store.scores=TRUE, std.var = TRUE)
# save the summary
sum.civil_lib <- summary(civil_lib_bfa)
| Attribute | Aggregation | Subattribute | Aggregation |
|---|---|---|---|
| 1. Representation (free and equal access to political power) | Bayesian factor analysis of credible elections, free political parties, elected government, effective parliament, and local democracy to create contestation index; thereafter, multiplication of contestation and inclusive suffrage | 1.1. Credible Elections | Item response modelling |
| 1.2. Inclusive Suffrage | Weighted average | ||
| 1.3. Free Political Parties | Item response modelling | ||
| 1.4. Elected Government | Item response modelling | ||
| 1.5. Effective Parliament | Item response modelling | ||
| 1.6. Local Democracy | Multiplication | ||
| 2. Rights (individual liberties and resources) | Bayesian factor analysis | 2.1. Access to Justice | Item response modelling |
| 2.2. Civil Liberties | First item response modelling by subcomponents (i.e. Freedom of Expression [IRT], Freedom of the Press [IRT], Freedom of Association and Assembly [IRT], Freedom of Religion [IRT], and Freedom of Movement [IRT]). Thereafter, Bayesian factor analysis of subcomponent indices. | ||
| 2.3. Basic Welfare | Item response modelling | ||
| 2.4. Political Equality | First item response modelling by subcomponents (i.e. Social Group Equality, Economic Equality, and Gender Equality). Thereafter, Bayesian factor analysis of subcomponent indices. | ||
| 3. Rule of Law (predictable and equal enforcement of the law, and limitation of government power) | Bayesian factor analysis | 3.1. Judicial Independence | Item response modelling |
| 3.2. Absence of Corruption | Item response modelling | ||
| 3.3. Predictable Enforcement | Item response modelling | ||
| 3.4. Personal Integrity and Security | Item response modelling | ||
| 4. Participation (instruments for realization of political involvement) | Item response modelling | 4.1. Civil Society | Item response modelling |
| 4.2. Civic Engagement | Item response modelling | ||
| 4.3. Electoral Participation | N/A (only one indicator) |
Step 5: Aggregating the indicators into Indices
Representation: As the data series for many of the indicators begins after 2000, four of the six subattributes were aggregated using IRT. The Inclusive Suffrage subattribute was computed as a weighted average of its two indicators. The Local Democracy index is computed through a multiplication of the two source indices. However, note that indicators for all the country–years without regular legislative and executive elections as coded by the LIED data set were scored the minimum value of 0.
The Inclusive Suffrage indicator was combined with the other five subattributes to construct an overall Representation index but only after the construction of an ‘intermediate’ index based on the other subattribute indices. Inspired by Dahl’s theoretical distinction between two dimensions of representative government—contestation and inclusion (1971, 1989; see also Coppedge, Alvarez and Maldonado 2008; Miller 2015)—the factor scores from a BFA were first used to construct a contestation index. Thereafter, a formative aggregation procedure was chosen to combine the contestation index with the suffrage measure. Although contestation and inclusion are not highly correlated, they both constitute necessary conditions for representative government. Accordingly, the representation index is based on a multiplication of the suffrage scores and the contestation index (both first re-scaled to vary between zero and one).
Rights: Much like the subattributes of Representation, there is incomplete coverage in the source indicators for Rights. Therefore, both Access to Justice and Basic Welfare indices were estimated through IRT. Regarding the second subattribute of Rights—Civil Liberties—all five subcomponent indices were constructed using IRT. In the next step, BFA was used to reduce the highly correlated subcomponents into a single index score for the Civil Liberties subattribute. IRT was used to construct the three subcomponents of the Political Equality subattribute, which were then combined in the subattribute using BFA. Finally, the four Rights subattributes were aggregated into the Rights index using BFA.
Rule of Law: As with the other attributes, the subattributes scores were estimated with IRT modelling, as incomplete temporal coverage in source indicators prevents the use of BFA. These subattribute scores were then used to estimate the Rule of Law index using a BFA model.
Participation: As with the other attributes, incomplete temporal coverage in source indicators prevents the use of BFA for the subattribute scores. The first two subattributes (Civil Society and Civic Engagement) were estimated using IRT. The Electoral Participation score is simply the reported turnout as a percentage of the voting age population and requires no further calculations. The three subattribute scores were then used to estimate the Participation index using an IRT model.
All the Indices in the data set offer nuanced scores in the form of interval scale measurement. The Indices have been normalized (Step 6) to range from 0 (lowest achievement among all the country–years) to 1 (highest achievement among all the country–years). A score of 0 generally refers to the worst performance in the whole sample of country–years covered by a particular index, while 1 refers to the best country–year performance in the sample. For a number of Indices, however, 0 also has an absolute meaning as the lowest score that is theoretically possible. The subattribute Indices capturing Credible Elections, Elected Government, Direct Democracy and Local Democracy all have substantively meaningful minimum values that refer to the total absence of the features in question.
Step 6: Scaling the Indices
The normalization of the Indices was carried out by subtracting for each country–year the minimum score for the index from the value of the country–year and by dividing the result by the difference between the maximum and the minimum value of the index. The formula used for the normalization of the Indices was:
x’i = (xi–min(xi)) ⁄ (max(xi)–min(xi))
where xi represents the value of index x for country–year i, while x’i represents the normalized value of index x for country–year i.
In this way, the lowest value in the population of country–years in the data set becomes 0, while the highest value in the same population of country–years in the data set becomes 1, and all the remaining country–years are given values between these two values.
For most indices, the yearly scores for each country are accompanied by uncertainty estimates, which can be used to assess whether differences between countries and within countries over time are significant. These uncertainty estimates, in the form of confidence intervals or margins of error, reflect the statistically likely range for the country–year index scores based on the indicators used.
The GSoD Indices confidence levels refer to one standard deviation below and above the estimated score. This means that about 68 per cent of the ‘true’ values would be found within these intervals. Confidence intervals are only available for those Indices that are constructed from multiple indicators. The more the underlying indicators are in agreement regarding the scoring (high–low) of a particular aspect of democracy, the narrower the confidence intervals. The more the underlying indicators are in disagreement, the wider the confidence intervals.
If the confidence levels overlap when comparing the scores for two or more countries on the same GSoD (attribute) index, the difference between the scores is less than two standard deviations and is therefore not statistically significant at the p=0.05 level. Similarly, overlapping confidence intervals for different years when comparing the scores of one country for a particular GSoD index also indicate that the difference is statistically insignificant. More generally, short-term fluctuations are hard to capture and should be interpreted with caution, while it is usually possible to be certain about longer-term trends.
Step 7: Computing the confidence intervals
Confidence intervals were computed by subtracting or adding the standard error from/to the estimated score. The lower bound of the 68 per cent confidence interval was computed by subtracting the standard error from the estimated score of the index, while the upper bound of the 68 per cent confidence interval was computed by adding the standard error to the estimated score of the index. These values were saved in the data set so that each index is represented by three different values: the point estimate and the two limits of the confidence interval. Confidence intervals have been computed for all the attributes and subattributes of democracy with the exception of Electoral Participation (4.3), which is composed of a single indicator, and the Inclusive Suffrage (1.2), Direct Democracy (0.0) and Local Democracy (1.6) subattributes, which are aggregated using a formative formula.
A series of validity checks was run throughout the process of constructing the GSoD Indices to verify that they truly measure what they are thought to be measuring. Comparisons with extant measures should indicate a high degree of correspondence between the GSoD measures and existing measures of the same phenomena.
Step 8: Validity checks
As discussed in Step 4, the dimensionality of each index was tested by running bivariate correlations for the indicators included in the index and various factor analyses, and computing Cronbach’s alpha coefficients. The correlation coefficients are shown in Annex F and the data from the dimensionality tests in Annex E.
In addition to the unidimensionality tests discussed above, a second type of validity check compared extant measures that attempt to capture relatively similar aspects of democracy at the attribute, subattribute or subcomponent levels. These measures were taken from eight large-scale data collection projects: the Bertelsmann Transformation Index (Bertelsmann Stiftung, various years); the Democracy Index (Economist Intelligence Unit 2016); the Freedom in the World survey (Freedom House 2017); the Perceptions of Electoral Integrity (PEI) data (Norris et al. 2016); Polity5 data (Marshall and Gurr 2020); the Worldwide Governance Indicators (Kaufmann, Kraay and Mastruzzi 2010); the Rule of Law Index (World Justice Project 2016); and the Varieties of Democracy (Coppedge et al. 2016a). For a summary of these data sets see Table G.1 in version 4 of the Technical Procedures Guide (Tufis 2020).
Assuming that the extant measures are valid, high correlations would indicate that the GSoD Indices are also valid. If the extant measures are based on similar or the same information, high correlations would indicate that the GSoD Indices are reliable. However, correlations should be interpreted with caution since none of the extant measures are perfect and many of them capture slightly different concepts compared to the GSoD Indices.
An additional validity check conducted for both indicators and Indices as constructed at various levels of aggregation was to plot the indicators and Indices over time for each country in the data set and visually check their validity using country-specific expertise. This allowed easy identification of whether the Indices constructed corresponded to or contradicted team-based knowledge of the situation in a particular country.
Finally, all the countries in each of the Indices were sorted at 10-year intervals (1975, 1985, 1995, 2005 and 2015) to check again the face validity of the Indices by comparing their relative position at these times, as well as the changes in their relative position over time, to confirm that these conformed with existing knowledge of the evolution of different countries over the period.
This Guide presents the technical procedures used to construct International IDEA’s Global State of Democracy Indices to provide a guide for those who want a better understanding of how the Indices were constructed and, eventually, for those who want to use, modify or build on the Indices. It provides a detailed step-by-step description of the procedures used, allowing the interested reader to follow each step.
It should be noted that this technical methodology only provides information about the method used to construct the Indices. The information presented in this document builds on and is complemented by an elaborate discussion of the conceptual background to the Indices in the GSoD Indices Methodology (Skaaning and Hudson 2025). If the reader is interested in a particular indicator used, more information is available in the GSoD Indices Codebook (Tufis and Hudson 2025). These three documents taken together provide complete information on the GSoD Indices.
The Annexes present additional information that some readers or users of the GSoD Indices might find useful, including a complete list of the data sets used as data sources (Annex A); a list of the countries, regions and subregions in the GSoD data set (Annex B); a list of the regional organizations included in the GSoD data set (Annex C); the attributes, subattributes and indicators included in the GSoD data set (Annex D); and the results of the unidimensionality and validity tests performed during the creation of the GSoD data set (Annexes E and F).
Beetham, D., Democracy and Human Rights (Cambridge: Polity, 1999)
Beetham, D., Carvalho, E., Landman, T. and Weir, T., Assessing the Quality of Democracy: A Practical Guide (Stockholm: International IDEA, 2008), <http://www.idea.int/publications/catalogue/assessing-quality-democracy-practical-guide>, accessed 31 June 2024
Bertelsmann Stiftung, Transformation Index (BTI), 2024, <http://www.bti-project.org>, accessed 31 May 2024
—, Bertelsmann Transformation Index: Towards Democracy and a Market Economy (Washington, DC: Brookings Institution Press, various years)
Chalmers, P., Package ‘mirt’ (2020), Version 1.32.1, <https://github.com/philchalmers/mirt>, accessed 1 August 2020
Coppedge, M., Alvarez, A. and Maldonado, C., ‘Two persistent dimensions of democracy: Contestation and inclusiveness’, Journal of Politics, 70/3 (2008), pp. 632–47, <https://doi.org/10.1017/S0022381608080663>
Coppedge, M. et al., V-Dem [Country-Year/Country-Date] Dataset v. 7 (Gothenburg: Varieties of Democracy (V-Dem) Project, 2016a)
—, V-Dem Country Coding Units v. 6. (Gothenburg: V-Dem Project, 2016b)
Coppedge, M. et al., V-Dem [Country-Year/Country-Date] Dataset v. 15 (Gothenburg: Varieties of Democracy (V-Dem) Project, 2025), <https://doi.org/10.23696/vdemds25>
Dahl, R. A., Polyarchy: Participation and Opposition (New Haven: Yale University Press, 1971)
—, Democracy and its Critics (New Haven: Yale University Press, 1989)
Economist Intelligence Unit (EIU), Democracy Index 2016: Revenge of the ‘Deplorables’ (London: EIU, 2016), <http://www.eiu.com/public/democracy_index.aspx>, accessed 14 July 2017
—, A Year of Democratic Setbacks and Popular Unrest (London: EIU, 2020), <http://www.eiu.com/public/democracy_index.aspx>, accessed 30 June 2024
Fariss, C., ‘Respect for human rights has improved over time: Modeling the changing standard of accountability’, American Political Science Review, 108/2 (2014), pp. 297–318, <https://doi.org/10.1017/S0003055414000070>
Freedom House, Freedom in the World, 1973–2017 (Washington, D.C.: Freedom House, 2017)
Freedom House, Freedom in the World, 1973–2019 (Washington, DC: Freedom House, 2020)
Gibney, M. et al., ‘The political terror scale 1976–2023’, <http://www.politicalterrorscale.org>, accessed 5 June 2025
Huntington, S. P., The Third Wave: Democratization in the Late Twentieth Century (Norman, OK: University of Oklahoma Press, 1991)
Institute for Health Metrics and Evaluation (IHME), Global Educational Attainment Distributions 1970–2030 (Seattle, WA: IHME, 2020)
International IDEA, ‘Geographic definitions of regions and in the Global State of Democracy’, Background Paper, 2017, <https://www.idea.int/gsod-2017/files/IDEA-GSOD-2017-BACKGROUND-PAPER-REGIONS.pdf>, accessed 30 June 2024
—, The Global State of Democracy 2023: The New Checks and Balances (Stockholm: International IDEA, 2023), <https://doi.org/10.31752/idea.2023.78>
International Labour Organization (ILO), Department of Statistics, ILOSTAT, <https://ilostat.ilo.org>, accessed 30 June 2024
Kaufmann, D., Kraay, A. and Mastruzzi, M., ‘The Worldwide Governance Indicators: Methodology and Analytical Issues’, World Bank Policy Research Working Paper No. 5430 (2010), <http://papers.ssrn.com/sol3/papers.cfm?abstract_id=1682130>, accessed 30 June 2024
Linzer, D. and Staton, J. K., ‘A global measure of judicial independence, 1948–2012’ (formerly, ‘A Measurement Model for Synthesizing Multiple Comparative Indicators: The Case of Judicial Independence’), Journal of Law and Courts, 3/2 (2015), pp. 223–56, <https://doi.org/10.1086/682150>
Marshall, M. G. and Gurr, T. R., Polity5 Project: Political Regime Characteristics and Transitions, 1800–2018, 23 April 2020, <http://www.systemicpeace.org>, accessed 5 June 2025
Martin, A. D., Quinn, K. M. and Park, J.-H., Package ‘MCMCpack’, Version 1.4.7, 2020, <https://CRAN.R-project.org/package=MCMCpack>, accessed 1 June 2020
Miller, M., ‘Democratic pieces: Autocratic elections and democratic development since 1815’, British Journal of Political Science, 45/3 (2015), pp. 501–30, <https://doi.org/10.1017/S0007123413000446>
Møller, J. and Skaaning, S.-E., ‘Respect for civil liberties during the third wave of democratization: Presenting a new dataset’, Social Indicators Research, 117/3 (2014a), pp. 1069–87, <https://doi.org/10.1007/s11205-013-0391-y>
—, The Rule of Law: Definitions, Measures, Patterns, and Causes (Houndmills: Palgrave, 2014b)
Norris, P. et al., ‘The expert survey of Perceptions of Electoral Integrity’, Release 4.5, (PEI_4.5), August 2016, <www.electoralintegrityproject.com>, accessed 14 July 2017
Norris, P. and Grömping, M., ‘The expert survey of Perceptions of Electoral Integrity’, Release 7.0, (PEI_7.0), April 2019, <www.electoralintegrityproject.com>, accessed 14 July 2020
Pemstein, D., Meserve, S. and Melton, J., ‘Democratic compromise: A latent variable analysis of ten measures of regime type’, Political Analysis, 18/4 (2010), pp. 426–49, <https://doi.org/10.1093/pan/mpq020>
Pemstein, D. et al., The V-Dem Measurement Model: Latent Variable Analysis for Cross-National and Cross-Temporal Expert-Coded Data, V-Dem Working Papers Series No. 20 (University of Gothenburg: Varieties of Democracy Institute, 2015)
Skaaning, S.-E., ‘Measuring civil liberty: An assessment of standards-based data sets’, Revista de Ciencia Política, 29/3 (2009), pp. 721–40, <https://doi.org/10.4067/S0718-090X2009000300003>
—, ‘The civil liberty dataset: Conceptualization and measurement’, Zeitschrift für vergleichende Politikwissenschaft/Comparative Governance and Politics, 2/1 (2008), pp. 29–51, <https://doi.org/10.1007/s12286-008-0003-4>
Skaaning, S.-E. and Hudson, A., The Global State of Democracy Indices Methodology: Conceptualization and Measurement Framework, Version 9 (2025) (Stockholm: International IDEA, 2025), <https://doi.org/10.31752/idea.2025.29>
Solt, F., ‘Measuring income inequality across countries and over time: The Standardized World Income Inequality Database’, Social Science Quarterly, 101/3 (2020), pp. 1183–99, SWIID Version 9.6, December 2023
Teorell, J., Coppedge, M., Skaaning, S.-E. and Lindberg, S., ‘Measuring Electoral Democracy with V-Dem Data: Introducing a New Polyarchy Index’, Varieties of Democracy Institute Working Paper No. 25, 2016
Tufis, C., The Global State of Democracy Indices Technical Procedures Guide, Version 4 (2020) (Stockholm: International IDEA, 2020), <https://doi.org/10.31752/idea.2020.56>
Tufis, C. and Hudson, A., The Global State of Democracy Indices Codebook, Version 9 (2025) (Stockholm: International IDEA, 2025), <https://doi.org/10.31752/idea.2025.24>
United Nations Educational, Scientific and Cultural Organization, Institute for Statistics (UIS), ‘Literacy rate’, ‘Infant mortality rate’, ‘Life expectancy’, <http://data.uis.unesco.org/Index.aspx>, accessed 14 July 2020
United Nations, Food and Agriculture Organization (FAO), FAOSTAT Database (Rome: FAO, 2020)
Whitten-Woodring, J. and Van Belle, D. A., ‘The correlates of media freedom: An introduction of the Global Media Freedom Dataset’, Political Science Research and Methods, 5/1 (2017), pp. 179–88, <https://doi.org/10.1017/psrm.2015.68>
World Bank, Global Findex Database, <https://data.worldbank.org>, accessed 5 June 2025
World Justice Project, Rule of Law Index 2016, 2016, <https://worldjusticeproject.org/sites/default/files/documents/RoLI_Final-Digital_0.pdf>, accessed 16 August 2017
Table A.1. Data sets used for collecting indicators
Data provider/source name | Data type | No. of | Spatial | Temporal coverage |
|---|---|---|---|---|
Bertelsmann Transformation Index | ES | 14 | 137 countries | 2006–2023 |
Bjørnskov and Rode | IC | 1 | 208 countries | 1950–2024 |
Civil Liberties Dataset | IC | 5 | 204 countries | 1975–2024 |
Freedom in the World | ES | 23 | 211 countries | 2012–2024 |
Freedom on the Net | ES | 3 | 71 countries | 2011–2023 |
Global Findex Database | OD | 1 | 217 countries | 2011–2023 |
Global Gender Gap Report | IC | 1 | 161 countries | 2006–2024 |
Global Health Observatory, World Health Organization | OD | 2 | 183 countries | 2000–2021 |
Global Media Freedom Dataset | IC | 1 | 166 countries | 1975–2024 |
Institute for Health Metrics and Evaluation | OD | 3 | 195 countries | 1970–2030 |
International Country Risk Guide | ES | 4 | 146 countries | 1984–2024 |
International IDEA Electoral Processes | OD | 1 | 202 countries | 1945–2025 |
International Labour Organization (ILO), Department of Statistics | OD | 2 | 227 countries | 1948–2024 |
Lexical Index of Electoral Democracy | IC, OD | 3 | 242 countries | 1789–2024 |
Political Terror Scale | IC | 1 | 173 countries | 1976–2023 |
Polity | IC | 4 | 194 countries | 1776–2024 |
Standardized World Income Inequality Database (SWIID) | OD | 1 | 199 countries | 1960–2023 |
UN Food and Agriculture Organization | OD | 1 | 186 countries | 1961–2022 |
UN Inter-agency Group for Child Mortality Estimation | OD | 1 | 196 countries | 1960–2024 |
UN World Population Prospects | OD | 1 | 212 countries | 1960–2024 |
United Nations E-Government Survey | ES | 1 | 193 countries | 2003–2024 |
V-Dem | ES | 80 | 202 countries | 1789–2024 |
Notes: ES = expert surveys; IC = standards-based in-house coding; OD = observational data; CM = composite measures.
Table B.1. List of countries included in International IDEA’s GSoD Indices
| Country | First year | Last year | Country–years |
|---|---|---|---|
| Afghanistan | 1975 | 2024 | 50 |
| Albania | 1975 | 2024 | 50 |
| Algeria | 1975 | 2024 | 50 |
| Angola | 1975 | 2024 | 50 |
| Argentina | 1975 | 2024 | 50 |
| Armenia | 1991 | 2024 | 34 |
| Australia | 1975 | 2024 | 50 |
| Austria | 1975 | 2024 | 50 |
| Azerbaijan | 1991 | 2024 | 34 |
| Bangladesh | 1975 | 2024 | 50 |
| Barbados | 1975 | 2024 | 50 |
| Belarus | 1991 | 2024 | 34 |
| Belgium | 1975 | 2024 | 50 |
| Benin | 1975 | 2024 | 50 |
| Bhutan | 1975 | 2024 | 50 |
| Bolivia | 1975 | 2024 | 50 |
| Bosnia and Herzegovina | 1992 | 2024 | 33 |
| Botswana | 1975 | 2024 | 50 |
| Brazil | 1975 | 2024 | 50 |
| Bulgaria | 1975 | 2024 | 50 |
| Burkina Faso | 1975 | 2024 | 50 |
| Burundi | 1975 | 2024 | 50 |
| Cabo Verde | 1975 | 2024 | 50 |
| Cambodia | 1975 | 2024 | 50 |
| Cameroon | 1975 | 2024 | 50 |
| Canada | 1975 | 2024 | 50 |
| Central African Republic | 1975 | 2024 | 50 |
| Chad | 1975 | 2024 | 50 |
| Chile | 1975 | 2024 | 50 |
| China | 1975 | 2024 | 50 |
| Colombia | 1975 | 2024 | 50 |
| Comoros | 1975 | 2024 | 50 |
| Congo | 1975 | 2024 | 50 |
| Costa Rica | 1975 | 2024 | 50 |
| Côte d’Ivoire | 1975 | 2024 | 50 |
| Croatia | 1991 | 2024 | 34 |
| Cuba | 1975 | 2024 | 50 |
| Cyprus | 1975 | 2024 | 50 |
| Czechia | 1975 | 2024 | 50 |
| Democratic People’s Republic of Korea | 1975 | 2024 | 50 |
| Democratic Republic of the Congo | 1975 | 2024 | 50 |
| Denmark | 1975 | 2024 | 50 |
| Djibouti | 1977 | 2024 | 48 |
| Dominican Republic | 1975 | 2024 | 50 |
| Ecuador | 1975 | 2024 | 50 |
| Egypt | 1975 | 2024 | 50 |
| El Salvador | 1975 | 2024 | 50 |
| Eritrea | 1993 | 2024 | 32 |
| Estonia | 1991 | 2024 | 34 |
| Eswatini | 1975 | 2024 | 50 |
| Ethiopia | 1975 | 2024 | 50 |
| Finland | 1975 | 2024 | 50 |
| France | 1975 | 2024 | 50 |
| Gabon | 1975 | 2024 | 50 |
| Gambia | 1975 | 2024 | 50 |
| Georgia | 1991 | 2024 | 34 |
| German Democratic Republic | 1975 | 1990 | 16 |
| Germany | 1975 | 2024 | 50 |
| Ghana | 1975 | 2024 | 50 |
| Greece | 1975 | 2024 | 50 |
| Guatemala | 1975 | 2024 | 50 |
| Guinea | 1975 | 2024 | 50 |
| Guinea-Bissau | 1975 | 2024 | 50 |
| Guyana | 1975 | 2024 | 50 |
| Haiti | 1975 | 2024 | 50 |
| Honduras | 1975 | 2024 | 50 |
| Hungary | 1975 | 2024 | 50 |
| Iceland | 1975 | 2024 | 50 |
| India | 1975 | 2024 | 50 |
| Indonesia | 1975 | 2024 | 50 |
| Iran | 1975 | 2024 | 50 |
| Iraq | 1975 | 2024 | 50 |
| Ireland | 1975 | 2024 | 50 |
| Israel | 1975 | 2024 | 50 |
| Italy | 1975 | 2024 | 50 |
| Jamaica | 1975 | 2024 | 50 |
| Japan | 1975 | 2024 | 50 |
| Jordan | 1975 | 2024 | 50 |
| Kazakhstan | 1991 | 2024 | 34 |
| Kenya | 1975 | 2024 | 50 |
| Kosovo | 2008 | 2024 | 17 |
| Kuwait | 1975 | 2024 | 50 |
| Kyrgyzstan | 1991 | 2024 | 34 |
| Lao People’s Democratic Republic | 1975 | 2024 | 50 |
| Latvia | 1991 | 2024 | 34 |
| Lebanon | 1975 | 2024 | 50 |
| Lesotho | 1975 | 2024 | 50 |
| Liberia | 1975 | 2024 | 50 |
| Libya | 1975 | 2024 | 50 |
| Lithuania | 1991 | 2024 | 34 |
| Luxembourg | 1975 | 2024 | 50 |
| Madagascar | 1975 | 2024 | 50 |
| Malawi | 1975 | 2024 | 50 |
| Malaysia | 1975 | 2024 | 50 |
| Maldives | 1975 | 2024 | 50 |
| Mali | 1975 | 2024 | 50 |
| Malta | 1975 | 2024 | 50 |
| Mauritania | 1975 | 2024 | 50 |
| Mauritius | 1975 | 2024 | 50 |
| Mexico | 1975 | 2024 | 50 |
| Mongolia | 1975 | 2024 | 50 |
| Morocco | 1975 | 2024 | 50 |
| Mozambique | 1975 | 2024 | 50 |
| Myanmar | 1975 | 2024 | 50 |
| Namibia | 1990 | 2024 | 34 |
| Nepal | 1975 | 2024 | 50 |
| Netherlands | 1975 | 2024 | 50 |
| New Zealand | 1975 | 2024 | 50 |
| Nicaragua | 1975 | 2024 | 50 |
| Niger | 1975 | 2024 | 50 |
| Nigeria | 1975 | 2024 | 50 |
| North Macedonia | 1991 | 2024 | 34 |
| Norway | 1975 | 2024 | 50 |
| Oman | 1975 | 2024 | 50 |
| Pakistan | 1975 | 2024 | 50 |
| Palestine | 1988 | 2024 | 37 |
| Panama | 1975 | 2024 | 50 |
| Papua New Guinea | 1975 | 2024 | 50 |
| Paraguay | 1975 | 2024 | 50 |
| Peru | 1975 | 2024 | 50 |
| Philippines | 1975 | 2024 | 50 |
| Poland | 1975 | 2024 | 50 |
| Portugal | 1975 | 2024 | 50 |
| Qatar | 1975 | 2024 | 50 |
| Republic of Korea | 1975 | 2024 | 50 |
| Republic of Moldova | 1991 | 2024 | 34 |
| Romania | 1975 | 2024 | 50 |
| Russian Federation | 1975 | 2024 | 50 |
| Rwanda | 1975 | 2024 | 50 |
| Saudi Arabia | 1975 | 2024 | 50 |
| Senegal | 1975 | 2024 | 50 |
| Serbia | 1975 | 2024 | 50 |
| Sierra Leone | 1975 | 2024 | 50 |
| Singapore | 1975 | 2024 | 50 |
| Slovakia | 1993 | 2024 | 32 |
| Slovenia | 1991 | 2024 | 34 |
| Somalia | 1975 | 2024 | 50 |
| South Africa | 1975 | 2024 | 50 |
| South Sudan | 2011 | 2024 | 14 |
| Spain | 1975 | 2024 | 50 |
| Sri Lanka | 1975 | 2024 | 50 |
| Sudan | 1975 | 2024 | 50 |
| Suriname | 1975 | 2024 | 50 |
| Sweden | 1975 | 2024 | 50 |
| Switzerland | 1975 | 2024 | 50 |
| Syrian Arab Republic | 1975 | 2024 | 50 |
| Taiwan | 1975 | 2024 | 50 |
| Tajikistan | 1991 | 2024 | 34 |
| Tanzania | 1975 | 2024 | 50 |
| Thailand | 1975 | 2024 | 50 |
| Timor-Leste | 2002 | 2024 | 23 |
| Togo | 1975 | 2024 | 50 |
| Trinidad and Tobago | 1975 | 2024 | 50 |
| Tunisia | 1975 | 2024 | 50 |
| Turkey | 1975 | 2024 | 50 |
| Turkmenistan | 1991 | 2024 | 34 |
| Uganda | 1975 | 2024 | 50 |
| Ukraine | 1991 | 2024 | 34 |
| United Kingdom of Great Britain and Northern Ireland | 1975 | 2024 | 50 |
| United States of America | 1975 | 2024 | 50 |
| Uruguay | 1975 | 2024 | 50 |
| Uzbekistan | 1991 | 2024 | 34 |
| Vanuatu | 1980 | 2024 | 45 |
| Venezuela | 1975 | 2024 | 50 |
| Viet Nam | 1975 | 2024 | 50 |
| Yemen | 1975 | 2024 | 50 |
| Zambia | 1975 | 2024 | 50 |
| Zimbabwe | 1975 | 2024 | 50 |
Notes: The country names in this table do not represent the official position of International IDEA with regard to the legal status of, or policy on, the entities mentioned. It is a harmonization of often-divergent lists and practices.
Table B.2. Division of countries into regions and subregions as covered by the GSoD Indices
| Region/subregion | Country |
|---|---|
| |
| East Africa | Burundi, Comoros, Djibouti, Eritrea, Ethiopia, Kenya, Rwanda, Somalia, Tanzania, Uganda |
| Central Africa | Cameroon, Central African Republic, Chad, Democratic Republic of the Congo, Equatorial Guinea, Gabon, Republic of Congo |
| Southern Africa | Angola, Botswana, Eswatini, Lesotho, Madagascar, Malawi, Mauritius, Mozambique, Namibia, South Africa, Zambia, Zimbabwe |
| West Africa | Benin, Burkina Faso, Cabo Verde, Côte d’Ivoire, Gambia, Ghana, Guinea, Guinea-Bissau, Liberia, Mali, Mauritania, Niger, Nigeria, Senegal, Sierra Leone, Togo |
| North Africa | Algeria, Egypt, Libya, Morocco, South Sudan, Sudan, Tunisia |
| |
| The Caribbean | Barbados, Cuba, Dominican Republic, Haiti, Jamaica, Trinidad and Tobago |
| Central America | Costa Rica, El Salvador, Guatemala, Honduras, Mexico, Nicaragua, Panama |
| South America | Argentina, Bolivia, Brazil, Chile, Colombia, Ecuador, Guyana, Paraguay, Peru, Suriname, Uruguay, Venezuela |
| North America | Canada, United States of America |
| |
| Central Asia | Kazakhstan, Kyrgyzstan, Tajikistan, Turkmenistan, Uzbekistan |
| East Asia | China, Democratic People’s Republic of Korea, Japan, Mongolia, Republic of Korea, Taiwan |
| South Asia | Afghanistan, Bangladesh, Bhutan, India, Maldives, Nepal, Pakistan, Sri Lanka |
| South-East Asia | Cambodia, Indonesia, Lao People’s Democratic Republic, Malaysia, Myanmar, Philippines, Singapore, Thailand, Timor-Leste, Viet Nam |
| Oceania | Australia, Fiji, New Zealand, Papua New Guinea, Solomon Islands, Vanuatu |
| |
| Western Asia | Bahrain, Iran, Iraq, Israel, Jordan, Kuwait, Lebanon, Oman, Palestine, Qatar, Saudi Arabia, Syrian Arab Republic, United Arab Emirates, Yemen |
| |
| Central Europe | Albania, Bosnia and Herzegovina, Bulgaria, Croatia, Czechia, Estonia, German Democratic Republic, Hungary, Kosovo, Latvia, Lithuania, Montenegro, North Macedonia, Poland, Romania, Serbia, Slovakia, Slovenia |
| Eastern Europe | Armenia, Azerbaijan, Belarus, Georgia, Republic of Moldova, Russian Federation, Ukraine |
| North and West Europe | Austria, Belgium, Denmark, Finland, France, Germany, Iceland, Ireland, Luxembourg, Netherlands, Norway, Sweden, Switzerland, United Kingdom of Great Britain and Northern Ireland |
| Southern Europe | Cyprus, Greece, Italy, Malta, Portugal, Spain, Turkey |
Notes: The country names in this table do not represent the official position of International IDEA with regard to the legal status of, or policy on, the entities mentioned. It is a harmonization of often-divergent lists and practices.
Table C.1. Regional organizations included in the data set
| Regional organization | Countries |
|---|---|
| African Union (AU) | Algeria, Angola, Benin, Botswana, Burkina Faso, Burundi, Cabo Verde, Cameroon, Central African Republic, Chad, Congo, Comoros, Côte d’Ivoire, Democratic Republic of the Congo (DRC), Djibouti, Egypt, Equatorial Guinea, Eritrea, Eswatini, Ethiopia, Gabon, Gambia, Ghana, Guinea, Guinea-Bissau, Kenya, Lesotho, Liberia, Libya, Madagascar, Malawi, Mali, Mauritania, Mauritius, Morocco, Mozambique, Namibia, Niger, Nigeria, Rwanda, Senegal, Sierra Leone, Somalia, South Africa, South Sudan, Sudan, Tanzania, Togo, Tunisia, Uganda, Zambia, Zimbabwe |
| Association of Southeast Asian Nations (ASEAN) | Cambodia, Indonesia, Laos, Malaysia, Myanmar, Philippines, Singapore, Thailand, Viet Nam |
| European Union (EU) | Austria, Belgium, Bulgaria, Croatia, Cyprus, Czechia, Denmark, Estonia, Finland, France, Germany, Greece, Hungary, Ireland, Italy, Latvia, Lithuania, Luxembourg, Netherlands, Poland, Portugal, Romania, Slovakia, Slovenia, Spain, Sweden, United Kingdom |
| Organisation for Economic Co-operation and Development (OECD) | Australia, Austria, Belgium, Canada, Chile, Colombia, Czechia, Denmark, Estonia, Finland, France, Germany, Greece, Hungary, Iceland, Ireland, Israel, Italy, Japan, Latvia, Lithuania, Luxembourg, Mexico, Netherlands, New Zealand, Norway, Poland, Portugal, Slovakia, Slovenia, Republic of Korea, Spain, Sweden, Switzerland, Turkey, United Kingdom, United States |
| Organization of American States (OAS) | Argentina, Barbados, Bolivia, Brazil, Canada, Chile, Colombia, Costa Rica, Dominican Republic, Ecuador, El Salvador, Guatemala, Guyana, Haiti, Honduras, Jamaica, Mexico, Nicaragua, Panama, Paraguay, Peru, Suriname, Trinidad and Tobago, United States, Uruguay, Venezuela |
Attributes, subattributes, assessment questions and empirical indicators
Table D.1. Attribute 1. Representation
Subattributes | Assessment questions | No. | Indicators |
|---|---|---|---|
1.1. Credible Elections | To what extent are elections free from irregularities? | 1.1.1 | EMB autonomy |
1.1.2 | EMB capacity | ||
1.1.3 | Election other voting irregularities | ||
1.1.4 | Election government intimidation | ||
1.1.5 | Election free and fair | ||
1.1.6 | Competition | ||
1.1.7 | A3 Electoral process | ||
1.1.8 | B2 Political Pluralism and Participation | ||
1.1.9 | B3 Political Pluralism and Participation | ||
1.1.10 | Free and fair elections | ||
1.2. Inclusive Suffrage | To what extent do all adult citizens have voting rights? | 1.2.1 | Suffrage |
1.2.2 | Election voter registry | ||
1.3. Free Political Parties | To what extent are political parties free to form and campaign for office? | 1.3.1 | Party ban |
1.3.2 | Barriers to parties | ||
1.3.3 | Opposition parties’ autonomy | ||
1.3.4 | Elections multiparty | ||
1.3.5 | Competitiveness of participation | ||
1.3.6 | Multiparty elections | ||
1.3.7 | B1 Political Pluralism and Participation | ||
1.4. Elected Government | To what extent is access to government determined by elections? | 1.4.1 | Elected officials index |
1.4.2 | Competitiveness of executive recruitment | ||
1.4.3 | Openness of executive recruitment | ||
1.4.4 | Electoral | ||
1.4.5 | A1 Electoral Process | ||
1.4.6 | A2 Electoral Process | ||
1.4.7 | C1 Functioning of Government | ||
1.4.8 | Lexical index of electoral democracy | ||
1.5. Effective Parliament | To what extent does parliament oversee the executive? | 1.5.1 | Legislature questions officials in practice |
1.5.2 | Executive oversight | ||
1.5.3 | Legislature investigates in practice | ||
1.5.4 | Legislature: opposition parties | ||
1.5.5 | Executive constraints | ||
1.6. Local Democracy | To what extent are there freely elected, influential local governments? | 1.6.1 | Local government index |
1.6.2 | Subnational elections free and fair | ||
1.6.3 | Local government elected |
Table D2. Attribute 2. Rights
Subattributes | Assessment questions | No. | Indicators |
|---|---|---|---|
2.1. Access to Justice | To what extent is there equal, fair access to justice? | 2.1.1 | Access to justice for men |
2.1.2 | Access to justice for women | ||
2.1.3 | Judicial corruption decision | ||
2.1.4 | Judicial accountability | ||
2.1.5 | Fair trial | ||
2.1.6 | F2 Rule of Law | ||
2.1.7 | Civil rights | ||
2.2. Civil Liberties | To what extent are civil liberties respected? | Subcomponent 2.2.A. Freedom of Expression | |
2.2.1 | Freedom of discussion for women | ||
2.2.2 | Freedom of discussion for men | ||
2.2.3 | Freedom of academic and cultural expression | ||
2.2.4 | Freedom of opinion and expression | ||
2.2.6 | A Obstacles to access | ||
2.2.7 | B Limits on content | ||
2.2.8 | C Violations of user rights | ||
2.2.9 | D3 Freedom of Expression and Belief | ||
2.2.10 | D4 Freedom of Expression and Belief | ||
2.2.11 | Freedom of expression | ||
Subcomponent 2.2.B. Freedom of the Press | |||
2.2.12 | Print/broadcast censorship effort | ||
2.2.13 | Harassment of journalists | ||
2.2.14 | Media self-censorship | ||
2.2.15 | Critical print/broadcast media | ||
2.2.16 | Print/broadcast media perspectives | ||
2.2.17 | Media bias | ||
2.2.18 | Media corrupt | ||
2.2.19 | Media freedom INVERTED | ||
2.2.20 | D1 Freedom of Expression and Belief | ||
Subcomponent 2.2.C. Freedom of Association and Assembly | |||
2.2.21 | CSO entry and exit | ||
2.2.22 | CSO repression | ||
2.2.23 | Freedom of peaceful assembly | ||
2.2.24 | Freedom of association and assembly | ||
2.2.28 | E1 Associational and Organizational Rights | ||
2.2.29 | E2 Associational and Organizational Rights | ||
2.2.30 | E3 Associational and Organizational Rights | ||
2.2.31 | Association/assembly rights | ||
Subcomponent 2.2.D. Freedom of Religion | |||
2.2.32 | Freedom of religion | ||
2.2.33 | Religious organization repression | ||
2.2.34 | Freedom of thought, conscience and religion | ||
2.2.36 | D2 Freedom of Expression and Belief | ||
Subcomponent 2.2.E. Freedom of Movement | |||
2.2.41 | Freedom of foreign movement | ||
2.2.42 | Freedom of domestic movement for women | ||
2.2.43 | Freedom of domestic movement for men | ||
2.2.44 | Freedom of movement and residence | ||
2.2.47 | G1 Personal Autonomy and Individual Rights | ||
2.3. Basic Welfare | To what extent is there basic welfare? | 2.3.1 | Infant mortality rate |
2.3.2 | Life expectancy | ||
2.3.3 | Kilocalories per person per day | ||
2.3.4 | Mean years of schooling (Male) | ||
2.3.5 | Mean years of schooling (Female) | ||
2.3.6 | Educational equality | ||
2.3.7 | Health equality | ||
2.3.8 | Healthy life expectancy at 60 (Male) | ||
2.3.9 | Healthy life expectancy at 60 (Female) | ||
2.4. Political Equality | To what extent is there political equality? | Subcomponent 2.4.A. Social Group Equality | |
2.4.1 | Social group equality in respect for civil liberties | ||
2.4.2 | Power distributed by social group | ||
2.4.3 | Power distributed by sexual orientation | ||
2.4.4 | Exclusion by political group index | ||
2.4.5 | Exclusion by social group index | ||
2.4.6 | B4 Political Pluralism and Participation | ||
2.4.7 | F4 Rule of Law | ||
2.4.8 | Equal opportunity | ||
Subcomponent 2.4.B. Economic Equality | |||
2.4.9 | Social class equality in respect for civil liberties | ||
2.4.10 | Power distributed by socio-economic position | ||
2.4.11 | Exclusion by social group index | ||
2.4.12 | Exclusion by urban–rural location index | ||
2.4.13 | Socioeconomic barriers | ||
2.4.14 | Gini coefficient | ||
Subcomponent 2.4.B. Gender Equality | |||
2.4.15 | Power distributed by gender | ||
2.4.16 | CSO women’s participation | ||
2.4.17 | Female vs. male mean years of schooling | ||
2.4.18 | Lower chamber female legislators | ||
2.4.19 | Exclusion by gender index | ||
2.4.22 | Political empowerment | ||
2.4.23 | Labour force participation rate (women - men) | ||
2.4.24 | Share of managerial positions held by women | ||
2.4.25 | Control of bank accounts (women - men) | ||
Table D3. Attribute 3. Rule of Law
Subattributes | Assessment questions | No. | Indicators |
|---|---|---|---|
3.1. Judicial Independence | To what extent are the courts independent? | 3.1.1 | High Court independence |
3.1.2 | Lower court independence | ||
3.1.3 | Compliance with higher court | ||
3.1.4 | Compliance with judiciary | ||
3.1.6 | F1 Rule of Law | ||
3.1.7 | Separation of power | ||
3.1.8 | Independent judiciary | ||
3.2. Absence of Corruption | To what extent is the exercise of public authority free from corruption? | 3.2.1 | Public sector: corrupt exchanges |
3.2.2 | Public sector theft | ||
3.2.3 | Executive embezzlement and theft | ||
3.2.4 | Executive bribery and corrupt exchanges | ||
3.2.5 | Corruption | ||
3.2.6 | C2 Functioning of Government | ||
3.2.7 | Prosecution of office abuse | ||
3.3. Predictable Enforcement | To what extent is the enforcement of public authority predictable? | 3.3.1 | Executive respects constitution |
3.3.2 | Transparent laws with predictable enforcement | ||
3.3.3 | Rigorous and impartial public administration | ||
3.3.4 | Criteria for appointment decisions in the state administration | ||
3.3.5 | Criteria for appointment decisions in the armed forces | ||
3.3.6 | Bureaucratic quality | ||
3.3.7 | Law and order | ||
3.3.8 | C3 Functioning of Government | ||
3.3.9 | Monopoly on the use of force | ||
3.3.10 | Basic administration | ||
3.4. Personal Integrity and Security | To what extent are people free from violence? | 3.4.1 | Freedom from torture |
3.4.2 | Freedom from political killings | ||
3.4.3 | Political terror scale | ||
3.4.4 | Internal conflict | ||
3.4.6 | G4 Personal Autonomy and Individual Rights | ||
3.4.7 | F3 Rule of Law |
Table D4. Attribute 4. Participation
Subattributes | Assessment question | No. | Indicators |
|---|---|---|---|
4.1. Civil Society | To what extent are civil society organizations free and influential? | 4.1.1 | CSO participatory environment |
4.1.2 | Engaged society | ||
4.1.3 | CSO consultation | ||
4.1.4 | EPI – E-participation Index | ||
4.1.5 | Interest groups | ||
4.1.6 | Social capital | ||
4.2. Civic Engagement | To what extent do people participate in civil society organizations? | 4.2.1 | Engagement in independent non-political associations |
4.2.2 | Engagement in independent political associations | ||
4.2.3 | Engagement in independent trade unions | ||
4.2.4 | Civil society traditions | ||
4.2.5 | Mobilization for democracy | ||
4.3. Electoral Participation | To what extent do people participate in national elections? | 4.3.1 | Election voting age population (VAP) turnout |
4.3.2 | Regular elections index |
Overview of indicators and sources
1. Representation
1.1. Indicators of Credible Elections
| No. | Indicator | Description/question | Data set |
|---|---|---|---|
| 1.1.1 | EMB autonomy (v2elembaut) | ES: Does the election management body (EMB) have autonomy from government to apply election laws and administrative rules impartially in national elections? | V-Dem |
| 1.1.2 | EMB capacity (v2elembcap) | ES: Does the election management body (EMB) have sufficient staff and resources to administer a well-run national election? | V-Dem |
| 1.1.3 | Election other voting irregularities (v2elirreg) | ES: In this national election, was there evidence of other intentional irregularities by incumbent and/or opposition parties and/or vote fraud? | V-Dem |
| 1.1.4 | Election government intimidation (v2elintim) | ES: In this national election, were opposition candidates/parties/campaign workers subjected to repression, intimidation, violence or harassment by the government, the ruling party or their agents? | V-Dem |
| 1.1.5 | Election free and fair (v2elfrfair) | ES: Taking all aspects of the pre-election period, election day and the post-election process into account, would you consider this national election to be free and fair? | V-Dem |
| 1.1.6 | Competition (competitive elections) | IC: The chief executive offices and seats in the effective legislative body are filled by elections characterized by uncertainty, meaning that the elections are, in principle, sufficiently free to enable the opposition to gain power if they were to attract sufficient support from the electorate. | LIED |
| 1.1.7 | Electoral Process (A3) | IC: Are the electoral laws and framework fair, and are they implemented impartially by the relevant election management bodies? | Freedom in the World |
| 1.1.8 | Political Pluralism and Participation (B2) | IC: Is there a realistic opportunity for the opposition to increase its support or gain power through elections? | Freedom in the World |
| 1.1.9 | Political Pluralism and Participation (B3) | IC: Are the people’s political choices free from domination by forces that are external to the political sphere, or by political forces that employ extrapolitical means? | Freedom in the World |
| 1.1.10 | Free and fair elections (elect) | IC: Ten-point scale corresponding to answer choices that range from ‘National elections, if held at all, are entirely unfree and unfair’ to ‘There are no constraints on free and fair elections’. | BTI |
Note: ES = expert surveys; IC = standards-based in-house coding.
1.2. Indicators of Inclusive Suffrage
| No. | Indicator | Description/question | Data set |
|---|---|---|---|
| 1.2.1 | Suffrage (v2elsuffrage) | OD: What percentage (%) of adult citizens (as defined by statute) has the legal right to vote in national elections? | V-Dem |
| 1.2.2 | Election voter registry (v2elrgstry) | ES: In this national election, was there a reasonably accurate voter registry in place and was it used? | V-Dem |
Note: ES = expert surveys; OD = observational data.
1.3. Indicators of Free Political Parties
| No. | Indicator | Description/question | Data set |
|---|---|---|---|
| 1.3.1 | Party ban (v2psparban) | ES: Are any parties banned? | V-Dem |
| 1.3.2 | Barriers to parties (v2psbars) | ES: How restrictive are the barriers to forming a party? | V-Dem |
| 1.3.3 | Opposition parties’ autonomy (v2psoppaut) | ES: Are opposition parties independent and autonomous of the ruling regime? | V-Dem |
| 1.3.4 | Elections multiparty (v2elmulpar) | ES: Was this national election multiparty? | V-Dem |
| 1.3.5 | Competitiveness of participation (parcomp) | IC: The competitiveness of participation refers to the extent to which alternative preferences for policy and leadership can be pursued in the political arena. | Polity |
| 1.3.6 | Multiparty elections (multiparty legislative elections) | OD: The lower house (or unicameral chamber) of the legislature is (at least in part) elected by voters facing more than one choice. Specifically, parties are not banned and (a) more than one party is allowed to compete or (b) elections are nonpartisan (i.e. all candidates run without party labels). | LIED |
| 1.3.7 | Political Pluralism and Participation (B1) | IC: Do the people have the right to organize in different political parties or other competitive political groupings of their choice, and is the system free of undue obstacles to the rise and fall of these competing parties or groupings? | Freedom in the World |
Note: ES = expert surveys; IC = standards-based in-house coding; OD = observational data.
1.4. Indicators of Elected Government
| No. | Indicator | Description/question | Data set |
|---|---|---|---|
| 1.4.1 | Elected officials index (v2x_elecoff) | CM: Are the chief executive and legislature appointed through popular elections? Measure based on 16 variables from expert survey data, in-house coded data and observational data collected by V-Dem.* | V-Dem |
| 1.4.2 | Competitiveness of executive recruitment (xrcomp) | IC: Competitiveness refers to the extent that prevailing modes of advancement give subordinates equal opportunities to become superordinates. | Polity |
| 1.4.3 | Openness of executive recruitment (xropen) | IC: Recruitment of the chief executive is ‘open’ to the extent that all the politically active population has an opportunity, in principle, to attain the position through a regularized process. | Polity |
| 1.4.4 | Electoral | IC: Does a country have no regular elections, elections in an effectively one-party state, elections with opposition parties but without an actual chance of government change, or full democracy? | Bjørnskov and Rode |
| 1.4.5 | Electoral Process (A1) | IC: Was the current head of government or other chief national authority elected through free and fair elections? | Freedom in the World |
| 1.4.6 | Electoral Process (A2) | IC: Were the current national legislative representatives elected through free and fair elections? | Freedom in the World |
| 1.4.7 | Functioning of Government (C1) | IC: Do the freely elected head of government and national legislative representatives determine the policies of the government? | Freedom in the World |
| 1.4.8 | Lexical index of electoral democracy (lexical_index_plus) | IC: We operationalize electoral democracy as a series of necessary-and-sufficient conditions arrayed in an ordinal scale. The resulting Lexical Index of Electoral Democracy (LIED). In this fashion, we arrive at an index that performs a classificatory function, each level identifies a unique and theoretically meaningful regime type, as well as a discriminating function. | LIED |
Note: IC = standards-based in-house coding; CM = composite measures.
* The 16 variables are: legislature bicameral; lower chamber elected; upper chamber elected; percentage of indirectly elected legislators lower chamber; percentage of indirectly elected legislators upper chamber; head of state selection by legislature in practice; head of state appointment in practice; head of government selection by legislature in practice; head of government appointment in practice; head of state appoints cabinet in practice; head of government appoints cabinet in practice; head of state dismisses ministers in practice; head of government dismisses ministers in practice; head of state the same as head of government; chief executive appointment by upper chamber implicit approval; and chief executive appointment by upper chamber.
1.5. Indicators of Effective Parliament
| No. | Indicator | Description/question | Data set |
|---|---|---|---|
| 1.5.1 | Legislature questions officials in practice (v2lgqstexp) | ES: In practice, does the legislature routinely question executive branch officials? | V-Dem |
| 1.5.2 | Executive oversight (v2lgotovst) | ES: If executive branch officials were engaged in unconstitutional, illegal or unethical activity, how likely is it that a body other than the legislature, such as a comptroller general, general prosecutor or ombudsman, would question or investigate them and issue an unfavourable decision or report? | V-Dem |
| 1.5.3 | Legislature investigates in practice (v2lginvstp) | ES: If the executive were engaged in unconstitutional, illegal or unethical activity, how likely is it that a legislative body (perhaps a whole chamber, perhaps a committee, whether aligned with government or opposition) would conduct an investigation that would result in a decision or report that is unfavourable to the executive? | V-Dem |
| 1.5.4 | Legislature opposition parties (v2lgoppart) | ES: Are opposition parties (those not in the ruling party or coalition) able to exercise oversight and investigatory functions against the wishes of the governing party or coalition? | V-Dem |
| 1.5.5 | Executive constraints (xconst) | IC: The extent of institutionalized constraints on the decision-making powers of chief executives, whether individuals or collectivities. | Polity |
Note: ES = expert surveys; IC = standards-based in-house coding.
1.6. Indicators of Local Democracy
| No. | Indicator | Description/question | Data set |
|---|---|---|---|
| 1.6.1 | Local government index (v2xel_locelec) | CM: Are there elected local governments, and if so to what extent can they operate without interference from unelected bodies at the local level? | V-Dem |
| 1.6.2 | Subnational elections free and fair (v2elffelr) | ES: Taking all aspects of the pre-election period, election day and the post-election process into account, would you consider subnational elections (regional and local, as previously identified) to be free and fair on average? | V-Dem |
| 1.6.3 | Local government elected (v2ellocelc) | ES: At the local level, are government (local government) offices elected in practice? | V-Dem |
Note: ES = expert surveys; CM = composite measures.
2. Rights (individual liberties and resources)
2.1. Indicators of Access to Justice
| No. | Indicator | Description/question | Data set |
|---|---|---|---|
| 2.1.1 | Access to justice for men (v2clacjstm) | ES: Do men enjoy secure and effective access to justice? | V-Dem |
| 2.1.2 | Access to justice for women (v2clacjstw) | ES: Do women enjoy equal, secure and effective access to justice? | V-Dem |
| 2.1.3 | Judicial corruption decision (v2jucorrdc) | ES: How often do individuals or businesses make undocumented extra payments or bribes in order to speed up or delay the process or to obtain a favourable judicial decision? | V-Dem |
| 2.1.4 | Judicial accountability (v2juaccnt) | ES: When judges are found responsible for serious misconduct, how often are they removed from their posts or otherwise disciplined? | V-Dem |
| 2.1.5 | Fair trial (fairtrial) | IC: Extent to which citizens have the right to a fair trial in practice, that is, they are not subjected to arbitrary arrest, detention or exile; they have the right to recognition as a person before the law, the right to be under the jurisdiction of, and to seek redress from, competent, independent and impartial tribunals, and the right to be heard and to be entitled to trial without undue delays if arrested, detained or charged with a criminal offence. | CLD |
| 2.1.6 | Rule of Law (F2) | IC: Does due process prevail in civil and criminal matters? | Freedom in the World |
| 2.1.7 | Civil Rights (civ_rights) | IC: Ten-point scale corresponding to answer choices that range from ‘Civil rights are systematically violated. There are no mechanisms and institutions to protect residents against violations of their rights’ to ‘Civil rights are codified by law and respected by all state institutions, which actively precent discrimination. Residents are effectively protected by mechanisms and institutions established to prosecute, punish, and redress violations of their rights’. | BTI |
Note: ES = expert surveys; IC = standards-based in-house coding.
2.2. Indicators of Civil Liberties
| No. | Indicator | Description/question | Data set |
|---|---|---|---|
| |||
| 2.2.1 | Freedom of discussion for women (v2cldiscw) | ES: Are women able to openly discuss political issues in private homes and in public spaces? | V-Dem |
| 2.2.2 | Freedom of discussion for men (v2cldiscm) | ES: Are men able to openly discuss political issues in private homes and in public spaces? | V-Dem |
| 2.2.3 | Freedom of academic and cultural expression (v2clacfree) | ES: Is there academic freedom and freedom of cultural expression related to political issues? | V-Dem |
| 2.2.4 | Freedom of opinion and expression (freexp) | IC: The extent to which individual citizens, groups and the media have freedom of opinion and expression, that is, the right of the citizens, groups and the press to hold views freely and to seek, obtain and pass on information on political issues broadly understood without being subject to actual limitations or restrictions. | CLD |
| 2.2.6 | Obstacles to access (A) | IC: Details infrastructural, economic, and political barriers to access; government decisions to shut off connectivity or block specific applications or technologies; legal, regulatory, and ownership control over Internet service providers; and the independence of regulatory bodies. | Freedom on the Net |
| 2.2.7 | Limits on content (B) | IC: Analyses legal regulations on content; technical filtering and blocking of websites; other forms of censorship and self-censorship; the vibrancy and diversity of online information space; and the use of digital tools for civic mobilization. | Freedom on the Net |
| 2.2.8 | Violations of user rights (C) | IC: Tackles legal protections and restrictions on free expression; surveillance and privacy; and legal and extralegal repercussions for online speech and activities, such as imprisonment, cyberattacks, or extralegal harassment and physical violence. | Freedom on the Net |
| 2.2.9 | Freedom of Expression and Belief (D3) | IC: Is there academic freedom, and is the educational system free from extensive political indoctrination? | Freedom in the World |
| 2.2.10 | Freedom of Expression and Belief (D4) | IC: Are individuals free to express their personal views on political or other sensitive topics without fear of surveillance or retribution? | Freedom in the World |
| 2.2.11 | Freedom of expression (express) | IC: Ten-point scale corresponding to answer choices that range from ‘Freedom of expression is denied. Independent media do not exist or are prohibited’ to ‘Freedom of expression is guaranteed against interference or government restrictions. Individuals, groups and the press can fully exercise these rights’. | BTI |
| |||
| 2.2.12 | Print/broadcast censorship effort (v2mecenefm) | ES: Does the government directly or indirectly attempt to censor the print or broadcast media? | V-Dem |
| 2.2.13 | Harassment of journalists (v2meharjrn) | ES: Are individual journalists harassed, i.e. threatened with libel, arrested, imprisoned, beaten or killed, by governmental or powerful non-governmental actors while engaged in legitimate journalistic activities? | V-Dem |
| 2.2.14 | Media self-censorship (v2meslfcen) | ES: Is there self-censorship among journalists when reporting on issues that the government considers politically sensitive? | V-Dem |
| 2.2.15 | Print/broadcast media critical (v2mecrit) | ES: Of the major print and broadcast outlets, how many routinely criticize the government? | V-Dem |
| 2.2.16 | Print/broadcast media perspectives (v2merange) | ES: Do the major print and broadcast media represent a wide range of political perspectives? | V-Dem |
| 2.2.17 | Media bias (v2mebias) | ES: Is there media bias against opposition parties or candidates? | V-Dem |
| 2.2.18 | Media corrupt (v2mecorrpt) | ES: Do journalists, publishers or broadcasters accept payments in exchange for altering news coverage? | V-Dem |
| 2.2.19 | Media freedom | IC: Is criticism of government and government officials a common and normal part of the political dialogue in the mediated public sphere? | Media Freedom Data |
| 2.2.20 | Freedom of Expression and Belief (D1) | IC: Are there free and independent media? | Freedom in the World |
| |||
| 2.2.21 | CSO entry and exit (v2cseeorgs) | ES: To what extent does the government achieve control over entry and exit by civil society organizations into public life? | V-Dem |
| 2.2.22 | CSO repression (v2csreprss) | ES: Does the government attempt to repress civil society organizations? | V-Dem |
| 2.2.23 | Freedom of peaceful assembly (v2caassemb) | ES: To what extent do state authorities respect and protect the right of peaceful assembly? | V-Dem |
| 2.2.24 | Freedom of association and assembly (freass) | IC: The extent to which individuals and groups have freedom of assembly and association, that is, the right of the citizens to gather freely and carry out peaceful demonstrations as well as to join, form and participate with other persons in political parties, cultural organizations, trade unions or the like of their choice without being subject to actual limitations or restrictions. | CLD |
| 2.2.28 | Associational and Organizational Rights (E1) | IC: Is there freedom of assembly? | Freedom in the World |
| 2.2.29 | Associational and Organizational Rights (E2) | IC: Is there freedom for non-governmental organizations, particularly those that are engaged in human rights- and governance-related work? | Freedom in the World |
| 2.2.30 | Associational and Organizational Rights (E3) | IC: Is there freedom for trade unions and similar professional or labour organizations? | Freedom in the World |
| 2.2.31 | Association/assembly rights (assembly) | IC: Ten-point scale corresponding to answer choices that range from ‘Association and assembly rights are denied. Independent civic groups do not exist or are prohibited’ to ‘Association and assembly rights are guaranteed against interference or government restrictions. Residents and civic groups can fully exercise these rights’. | BTI |
| |||
| 2.2.32 | Freedom of religion (v2clrelig) | ES: Is there freedom of religion? | V-Dem |
| 2.2.33 | Religious organization repression (v2csrlgrep) | ES: Does the government attempt to repress religious organizations? | V-Dem |
| 2.2.34 | Freedom of thought, conscience and religion (frerel) | IC: The extent to which individuals and groups have freedom of thought, conscience and religion, that is, the right of citizens to have and change religion or belief of their own volition and alone or in community, manifest their religion or belief in practice, worship, observance and teaching in private or public, as well as proselytize peacefully without being subject to actual limitations or restrictions. | CLD |
| 2.2.36 | Freedom of Expression and Belief (D2) | IC: Are individuals free to practise and express their religious faith or nonbelief in public and private? | Freedom in the World |
| |||
| 2.2.41 | Freedom of foreign movement (v2clfmove) | ES: Is there freedom of foreign travel and emigration? | V-Dem |
| 2.2.42 | Freedom of domestic movement for women (v2cldmovew) | ES: Do women enjoy freedom of movement within the country? | V-Dem |
| 2.2.43 | Freedom of domestic movement for men (v2cldmovem) | ES: Do men enjoy freedom of movement within the country? | V-Dem |
| 2.2.44 | Freedom of movement and residence (fremov) | IC: The extent to which individuals and groups have freedom of movement and residence, that is, the right of citizens to settle and travel within their country as well as to leave and return to their country of own choice without being subject to actual limitations or restrictions. | CLD |
| 2.2.47 | Personal Autonomy and Individual Rights (G1) | IC: Do individuals enjoy freedom of movement, including the ability to change their place of residence, employment, or education? | Freedom in the World |
Note: ES = expert surveys; IC = standards-based in-house coding.
2.3. Indicators of Basic Welfare
| No. | Indicator | Description/question | Data set |
|---|---|---|---|
| 2.3.1 | Infant mortality rate | OD | CME |
| 2.3.2 | Life expectancy | OD | WPP |
| 2.3.3 | Kilocalories per person per day | OD | FAO |
| 2.3.4 | Mean years of schooling – Male | OD | IHME |
| 2.3.5 | Mean years of schooling – Female | OD | IHME |
| 2.3.6 | Educational equality (v2peedueq) | ES: To what extent is high quality basic education guaranteed to all, sufficient to enable them to exercise their basic rights as adult citizens? | V-Dem |
| 2.3.7 | Health equality (v2pehealth) | ES: To what extent is high quality basic healthcare guaranteed to all, sufficient to enable them to exercise their basic political rights as adult citizens? | V-Dem |
| 2.3.8 | Healthy life expectancy at 60 – Male (WHOSIS_000007) | OD | WHO |
| 2.3.9 | Healthy life expectancy at 60 – Female (WHOSIS_000007) | OD | WHO |
Note: ES = expert surveys; IC = standards-based in-house coding; OD = observational data.
2.4. Indicators of Political Equality
| No. | Indicator | Description/question | Data set |
|---|---|---|---|
| |||
| 2.4.1 | Social group equality in respect for civil liberties (v2clsocgrp) | ES: Do all social groups, as distinguished by language, ethnicity, religion, race, region or caste, enjoy the same level of civil liberties, or are some groups generally in a more favourable position? | V-Dem |
| 2.4.2 | Power distributed by social group (v2pepwrsoc) | ES: Is political power distributed according to social groups? | V-Dem |
| 2.4.3 | Power distributed by sexual orientation (v2pepwrort) | ES: Is political power distributed according to sexual orientation? | V-Dem |
| 2.4.4 | Exclusion by political group index (v2xpe_exlpol) | ES: Index of political exclusion by political group. | V-Dem |
| 2.4.5 | Exclusion by social group index (v2xpe_exlsocgr) | ES: Index of political exclusion by social group. | V-Dem |
| 2.4.6 | Political Pluralism and Participation (B4) | IC: Do various segments of the population (including ethnic, racial, religious, gender, LGBT+, and other relevant groups) have full political rights and electoral opportunities? | Freedom in the World |
| 2.4.7 | Rule of Law (F4) | IC: Do laws, policies, and practices guarantee equal treatment of various segments of the population? | Freedom in the World |
| 2.4.8 | Equal opportunity (equal) | IC: Ten-point scale corresponding to answer choices that range from ‘Equality of opportunity is not achieved. Women and/or members of ethnic, religious and other groups have only very limited access to education, public office and employment. There are no legal provisions against discrimination’ to ‘Equality of opportunity is achieved. Women and members of ethnic, religious and other groups have equal access to education, public office and employment. There is a comprehensive and effective legal and institutional framework for the protection against discrimination’. | BTI |
| |||
| 2.4.9 | Social class equality in respect for civil liberties (v2clacjust) | ES: Do poor people enjoy the same level of civil liberties as rich people? | V-Dem |
| 2.4.10 | Power distributed by socio-economic position (v2pepwrses) | ES: Is political power distributed according to socio-economic position? | V-Dem |
| 2.4.11 | Exclusion by socio-economic group (v2xpe_exlecon) | ES: Index of political exclusion by socio-economic group. | V-Dem |
| 2.4.12 | Exclusion by urban–rural location index (v2xpe_exlgeo) | ES: Index of political exclusion by urban–rural location. | V-Dem |
| 2.4.13 | Socio-economic barriers (barriers) | IC: Ten-point scale corresponding to answer choices that range from ‘Poverty and inequality are extensive and structurally ingrained’ to ‘Poverty and inequality are minor and not structurally ingrained.’ | BTI |
| 2.4.14 | Gini coefficient | OD | SWIID |
| |||
| 2.4.15 | Power distributed by gender (v2pepwrgen) | ES: Is political power distributed according to gender? | V-Dem |
| 2.4.16 | CSO women’s participation (v2csgender) | ES: Are women prevented from participating in civil society organizations? | V-Dem |
| 2.4.17 | Female vs. male mean years of schooling | OD | GHDx |
| 2.4.18 | Lower chamber female legislators (v2lgfemleg) | OD | V-Dem |
| 2.4.19 | Exclusion by gender index (v2xpe_exlgender) | ES: Index of political exclusion by gender. | V-Dem |
| 2.4.22 | Political empowerment | CM: The Global Gender Gap Index examines the gap between men and women across four fundamental categories (subindexes): Economic Participation and Opportunity, Educational Attainment, Health and Survival, and Political Empowerment. | Global Gender Gap Report |
| 2.4.23 | Labour force participation rate (women - men) | OD | ILO |
| 2.4.24 | Share of managerial positions held by women | OD | ILO |
| 2.4.25 | Control of bank accounts (women - men) | OD | World Bank |
Note: ES = expert surveys; IC = standards-based in-house coding; OD = observational data; CM = composite measures.
3. Rule of Law (effective control of executive power)
3.1. Indicators of Judicial Independence
| No. | Indicator | Description/question | Data set |
|---|---|---|---|
| 3.1.1 | High Court independence (v2juhcind) | ES: When the High Court in the judicial system is ruling in cases that are salient to the government, how often would you say that it makes decisions that merely reflect government wishes regardless of its sincere view of the legal record? | V-Dem |
| 3.1.2 | Lower court independence (v2juncind) | ES: When judges not on the High Court are ruling in cases that are salient to the government, how often would you say that their decisions merely reflect government wishes regardless of their sincere view of the legal record? | V-Dem |
| 3.1.3 | Compliance with High Court (v2juhccomp) | ES: How often would you say the government complies with important decisions of the High Court with which it disagrees? | V-Dem |
| 3.1.4 | Compliance with judiciary (v2jucomp) | ES: How often would you say the government complies with important decisions by other courts with which it disagrees? | V-Dem |
| 3.1.6 | Rule of Law (F1) | IC: Is there an independent judiciary? | Freedom in the World |
| 3.1.7 | Separation of power (separation) | IC: Ten-point scale corresponding to answer choices that range from ‘There is no separation of powers, neither de jure nor de facto’ to ‘There is a clear separation of powers with mutual checks and balances’. | BTI |
| 3.1.8 | Independent judiciary (judiciary) | IC: Ten-point scale corresponding to answer choices that range from ‘The judiciary is not independent and not institutionally differentiated’ to ‘The judiciary is independent and free both from unconstitutional intervention by other institutions and from corruption. It is institutionally differentiated, and there are mechanisms for judicial review of legislative or executive acts’. | BTI |
Note: ES = expert surveys; IC = standards-based in-house coding
3.2. Indicators of Absence of Corruption
| No. | Indicator | Description/question | Data set |
|---|---|---|---|
| 3.2.1 | Public sector corrupt exchanges (v2excrptps) | ES: How routinely do public sector employees grant favours in exchange for bribes, kickbacks or other material inducements? | V-Dem |
| 3.2.2 | Public sector theft (v2exthftps) | ES: How often do public sector employees steal, embezzle or misappropriate public funds or other state resources for personal or family use? | V-Dem |
| 3.2.3 | Executive embezzlement and theft (v2exembez) | ES: How often do members of the executive (the head of state, the head of government and cabinet ministers) or their agents steal, embezzle or misappropriate public funds or other state resources for personal or family use? | V-Dem |
| 3.2.4 | Executive bribery and corrupt exchanges (v2exbribe) | ES: How routinely do members of the executive (the head of state, the head of government and cabinet ministers) or their agents grant favours in exchange for bribes, kickbacks or other material inducements? | V-Dem |
| 3.2.5 | Corruption (F) | ES: How widespread is actual or potential corruption in the form of excessive patronage, nepotism, job reservations, ‘favour-for-favours’, secret party funding or suspiciously close ties between politics and business? | ICRG |
| 3.2.6 | Functioning of Government (C2) | IC: Are safeguards against official corruption strong and effective? | Freedom in the World |
| 3.2.7 | Prosecution of office abuse (prosecution) | IC: Ten-point scale corresponding to answer choices that range from ‘Officeholders who break the law and engage in corruption can do so without fear of legal consequences or adverse publicity’ to ‘Officeholders who break the law and engage in corruption are prosecuted rigorously under established laws and always attract adverse publicity’. | BTI |
Note: ES = expert surveys; IC = standards-based in-house coding.
3.3. Indicators of Predictable Enforcement
| No. | Indicator | Description/question | Data set |
|---|---|---|---|
| 3.3.1 | Executive respects constitution (v2exrescon) | ES: Do members of the executive (the head of state, the head of government and cabinet ministers) respect the constitution? | V-Dem |
| 3.3.2 | Transparent laws with predictable enforcement (v2cltrnslw) | ES: Are the laws of the land clear, well-publicized, coherent (consistent with each other), relatively stable from year to year and enforced in a predictable manner? | V-Dem |
| 3.3.3 | Rigorous and impartial public administration (v2clrspct) | ES: Are public officials rigorous and impartial in the performance of their duties? | V-Dem |
| 3.3.4 | Criteria for appointment decisions in the state administration (v2stcritrecadm) | ES: To what extent are appointment decisions in the state administration based on personal and political connections, as opposed to skills and merit? | V-Dem |
| 3.3.5 | Criteria for appointment decisions in the armed forces (v2stcritapparm) | ES: To what extent are appointment decisions in the armed forces based on personal or political connections or alternatively based on skills and merit? | V-Dem |
| 3.3.6 | Bureaucratic quality (L) | ES: Bureaucracy has the strength and expertise to govern without drastic changes in policy or interruptions in government services. | ICRG |
| 3.3.7 | Law and order (I) | ES: To what extent is the legal system strong and impartial and to what degree is there popular observance of the law? | ICRG |
| 3.3.8 | Functioning of Government (C3) | IC: Does government operate with openness and transparency? | Freedom in the World |
| 3.3.9 | Monopoly on the use of force (monopoly) | IC: Ten-point scale corresponding to answer choices that range from ‘There is no state monopoly on the use of force’ to ‘There is no competition with the state’s monopoly on the use of force throughout the entire territory’. | BTI |
| 3.3.10 | Basic administration (admin) | IC: Ten-point scale corresponding to answer choices that range from ‘The administrative structures of the state are limited to keeping the peace and maintaining law and order. Their territorial scope is very limited, and broad segments of the population are not covered’ to ‘The state has a differentiated administrative structure throughout the country which provides all basic public services’. | BTI |
Note: ES = expert surveys; IC = standards-based in-house coding.
3.4. Indicators of Personal Integrity and Security
| No. | Indicator | Description/question | Data set |
|---|---|---|---|
| 3.4.1 | Freedom from torture (v2cltort) | ES: Is there freedom from torture? | V-Dem |
| 3.4.2 | Freedom from political killings (v2clkill) | ES: Is there freedom from political killings? | V-Dem |
| 3.4.3 | Political terror scale (PTSsd) | IC: What is the level of political violence and terror? | Gibney et al. |
| 3.4.4 | Internal conflict (D) | ES: Is there political violence in the country? The rating assigned is the sum of three subcomponents: civil war/coup threat, terrorism/political violence and civil disorder. | ICRG |
| 3.4.6 | Personal Autonomy and Individual Rights (G4) | IC: Do individuals enjoy equality of opportunity and freedom from economic exploitation? | Freedom in the World |
| 3.4.7 | Rule of Law (F3) | IC: Is there protection from the illegitimate use of physical force and freedom from war and insurgencies? | Freedom in the World |
Note: ES = expert surveys; IC = standards-based in-house coding.
4. Participation (instruments for and realization of political involvement)
4.1. Indicators of Civil Society
| No. | Indicator | Description/question | Data set |
|---|---|---|---|
| 4.1.1 | CSO participatory environment (v2csprtcpt) | ES: Are people involved in civil society organizations? | V-Dem |
| 4.1.2 | Engaged society (v2dlengage) | ES: When important policy changes are being considered, how wide and how independent are public deliberations? | V-Dem |
| 4.1.3 | CSO consultation (v2csnsult) | ES: Are major civil society organizations (CSOs) routinely consulted by policymakers on policies relevant to their members? | V-Dem |
| 4.1.4 | E-Participation index | CM: EPI is a multifaceted framework, composed of three core components, i.e. e-information, e-consultation and e-decision-making. | United Nations E-Government Survey |
| 4.1.5 | Interest groups (int_group) | IC: Ten-point scale corresponding to answer choices that range from ‘Interest groups are present only in isolated social segments, are on the whole poorly balanced and cooperate little. A large number of social interests remain unrepresented’ to ‘There is a broad range of interest groups that reflect competing social interests, tend to balance one another and are cooperative’. | BTI |
| 4.1.6 | Social capital (soc_cap) | IC: Ten-point scale corresponding to answer choices that range from ‘There is a very low level of trust among the population, and civic self-organization is rudimentary’ to ‘There is a very high level of trust among the population and a large number of autonomous, self-organized groups, associations and organizations’. | BTI |
Note: ES = expert surveys; CM = composite measure; IC = standards-based in-house coding.
4.2 Indicators of Civic Engagement
| No. | Indicator | Description/question | Data set |
|---|---|---|---|
| 4.2.1 | Engagement in independent non-political associations (v2canonpol) | ES: What share of the population is regularly active in independent non-political associations, such as sports clubs, literary societies, charities, fraternal groups, or support groups? | V-Dem |
| 4.2.2 | Engagement in independent political associations (v2capolit) | ES: What share of the population is regularly active in independent political interest associations, such as environmental associations, animal rights groups, or LGBT rights groups? | V-Dem |
| 4.2.3 | Engagement in independent trade unions (v2catrauni) | ES: What share of the population is regularly active in independent trade unions? | V-Dem |
| 4.2.4 | Civil society traditions (civil_trad) | IC: Ten-point scale corresponding to answer choices that range from ‘Traditions of civil society are very strong’ to ‘Traditions of civil society are very weak’. | BTI |
| 4.2.5 | Mobilization for democracy (v2cademmob) | ES: In this year, how frequent and large have events of mass mobilization for pro-autocratic aims been? | V-Dem |
Note: IC = standards-based in-house coding; ES = expert surveys.
4.3. Indicators of Electoral Participation
| No. | Indicator | Description/question | Data set |
|---|---|---|---|
| 4.3.1 | Election VAP turnout (VAP turnout) | OD | International IDEA |
| 4.3.2 | Electoral regime index (v2x_elecreg) | ES: At this time, are regularly scheduled national elections on course, as stipulated by election law or well-established precedent? | V-Dem |
Note: OD = observational data; ES = expert surveys.
Additional index
0.0 Indicators of Direct Democracy
| No. | Indicator | Description/question | Data set |
|---|---|---|---|
| Direct popular vote index (v2xdd_dd) | CM: Measure based on 12 observable variables from V-Dem, resulting from the combination of scores for each type of popular vote (i.e. popular initiatives, referendums, plebiscites and obligatory referendums). The measure captures how easy it is to initiate and approve each type of popular vote and how consequential that vote is (if approved). Ease of initiation is measured by the existence of a direct democratic process, the number of signatures needed and the time limit to collect signatures. Ease of approval is measured by quorums pertaining to participation, approval, supermajority and district majority. Consequences are measured by the legal status of the decision made by citizens (binding or consultative) and the frequency with which direct popular votes have been used and approved in the past. | V-Dem |
Note: CM = composite measures.
Summary of indicators
ID | Indicator | Data set | Variable | Missing (N) | Missing (%) | Year (min) | Year (max) |
|---|---|---|---|---|---|---|---|
1.1.1 | EMB autonomy | V-Dem | v2elembaut | 0 | 0.00% | 1975 | 2024 |
1.1.2 | EMB capacity | V-Dem | v2elembcap | 0 | 0.00% | 1975 | 2024 |
1.1.3 | Election: other voting irregularities | V-Dem | v2elirreg | 93 | 1.14% | 1975 | 2024 |
1.1.4 | Election government intimidation | V-Dem | v2elintim | 93 | 1.14% | 1975 | 2024 |
1.1.5 | Election free and fair | V-Dem | v2elfrfair | 112 | 1.37% | 1975 | 2024 |
1.1.6 | Competition | LIED | competitive elections | 1 | 0.01% | 1975 | 2024 |
1.1.7 | A3 Electoral process | Freedom in the World | A3 | 5108 | 62.48% | 2012 | 2024 |
1.1.8 | B2 Political Pluralism and Participation | Freedom in the World | B2 | 5108 | 62.48% | 2012 | 2024 |
1.1.9 | B3 Political Pluralism and Participation | Freedom in the World | B3 | 5108 | 62.48% | 2012 | 2024 |
1.1.10 | Free and fair elections | BTI | elect | 5580 | 68.25% | 2006 | 2024 |
1.2.1 | Suffrage | V-Dem | v2elsuffrage | 0 | 0.00% | 1975 | 2024 |
1.2.2 | Election voter registry | V-Dem | V2elrgstry | 93 | 1.14% | 1975 | 2024 |
1.3.1 | Party ban | V-Dem | v2psparban | 0 | 0.00% | 1975 | 2024 |
1.3.2 | Barriers to parties | V-Dem | v2psbars | 0 | 0.00% | 1975 | 2024 |
1.3.3 | Opposition parties’ autonomy | V-Dem | v2psoppaut | 196 | 2.40% | 1975 | 2024 |
1.3.4 | Elections multiparty | V-Dem | v2elmulpar | 93 | 1.14% | 1975 | 2024 |
1.3.5 | Competitiveness of participation | Polity | parcomp | 596 | 7.29% | 1975 | 2024 |
1.3.6 | Multiparty elections | LIED | multiparty legislative elections | 1 | 0.01% | 1975 | 2024 |
1.3.7 | B1 Political Pluralism and Participation | Freedom in the World | B1 | 5927 | 72.49% | 2012 | 2024 |
1.4.1 | Elected officials index | V-Dem | v2x_elecoff | 0 | 0.00% | 1975 | 2024 |
1.4.2 | Competitiveness of executive recruitment | Polity | xrcomp | 420 | 5.14% | 1975 | 2024 |
1.4.3 | Openness of executive recruitment | Polity | xropen | 420 | 5.14% | 1975 | 2024 |
1.4.4 | Electoral | BRRD | Electoral | 4 | 0.05% | 1975 | 2024 |
1.4.5 | A1 Electoral Process | Freedom in the World | A1 | 5108 | 62.48% | 2012 | 2024 |
1.4.6 | A2 Electoral Process | Freedom in the World | A2 | 5108 | 62.48% | 2012 | 2024 |
1.4.7 | C1 Functioning of Government | Freedom in the World | C1 | 5108 | 62.48% | 2012 | 2024 |
1.4.8 | Lexical index of electoral democracy | LIED | lexical_index_plus | 2 | 0.02% | 1975 | 2024 |
1.5.1 | Legislature questions officials in practice | V-Dem | v2lgqstexp | 89 | 1.09% | 1975 | 2024 |
1.5.2 | Executive oversight | V-Dem | v2lgotovst | 29 | 0.35% | 1975 | 2024 |
1.5.3 | Legislature investigates in practice | V-Dem | v2lginvstp | 40 | 0.49% | 1975 | 2024 |
1.5.4 | Legislature opposition parties | V-Dem | v2lgoppart | 86 | 1.05% | 1975 | 2024 |
1.5.5 | Executive constraints | Polity | xconst | 420 | 5.14% | 1975 | 2024 |
1.6.1 | Local government index | V-Dem | v2xel_locelec | 189 | 2.31% | 1975 | 2024 |
1.6.2 | Subnational elections free and fair | V-Dem | v2elffelr | 571 | 6.98% | 1975 | 2024 |
1.6.3 | Local government elected | V-Dem | v3ellocelc | 353 | 4.32% | 1975 | 2024 |
2.1.1 | Access to justice for men | V-Dem | v2clacjstm | 0 | 0.00% | 1975 | 2024 |
2.1.2 | Access to justice for women | V-Dem | v2clacjstw | 0 | 0.00% | 1975 | 2024 |
2.1.3 | Judicial corruption decision | V-Dem | v2jucorrdc | 30 | 0.37% | 1975 | 2024 |
2.1.4 | Judicial accountability | V-Dem | v2juaccnt | 0 | 0.00% | 1975 | 2024 |
2.1.5 | Fair trial | CLD | fairtrial | 38 | 0.46% | 1975 | 2024 |
2.1.6 | F2 Rule of Law | Freedom in the World | F2 | 5927 | 72.49% | 2012 | 2024 |
2.1.7 | Civil Rights | BTI | civ_rights | 5580 | 68.25% | 2006 | 2024 |
2.2.1 | Freedom of discussion for women | V-Dem | v2cldiscw | 0 | 0.00% | 1975 | 2024 |
2.2.2 | Freedom of discussion for men | V-Dem | v2cldiscm | 0 | 0.00% | 1975 | 2024 |
2.2.3 | Freedom of academic and cultural expression | V-Dem | v2clacfree | 0 | 0.00% | 1975 | 2024 |
2.2.4 | Freedom of opinion and expression | CLD | freexp | 38 | 0.46% | 1975 | 2024 |
2.2.6 | A. Obstacles to access | Freedom on the Net | A | 7295 | 89.22% | 2011 | 2024 |
2.2.7 | B. Limits on content | Freedom on the Net | B | 7295 | 89.22% | 2011 | 2024 |
2.2.8 | C. Violations of user rights | Freedom on the Net | C | 7295 | 89.22% | 2011 | 2024 |
2.2.9 | D3 Freedom of Expression and Belief | Freedom in the World | D3 | 5927 | 72.49% | 2012 | 2024 |
2.2.10 | D4 Freedom of Expression and Belief | Freedom in the World | D4 | 5927 | 72.49% | 2012 | 2024 |
2.2.11 | Freedom of expression | BTI | express | 5580 | 68.25% | 2006 | 2024 |
2.2.12 | Print/broadcast censorship effort | V-Dem | v2mecenefm | 0 | 0.00% | 1975 | 2024 |
2.2.13 | Harassment of journalists | V-Dem | v2meharjrn | 0 | 0.00% | 1975 | 2024 |
2.2.14 | Media self-censorship | V-Dem | v2meslfcen | 0 | 0.00% | 1975 | 2024 |
2.2.15 | Print/broadcast media critical | V-Dem | v2mecrit | 0 | 0.00% | 1975 | 2024 |
2.2.16 | Print/broadcast media perspectives | V-Dem | v2merange | 0 | 0.00% | 1975 | 2024 |
2.2.17 | Media bias | V-Dem | v2mebias | 0 | 0.00% | 1975 | 2024 |
2.2.18 | Media corrupt | V-Dem | v2mecorrpt | 0 | 0.00% | 1975 | 2024 |
2.2.19 | Media freedom | Media Freedom Data | MFD | 393 | 4.81% | 1975 | 2024 |
2.2.20 | D1 Freedom of Expression and Belief | Freedom in the World | D1 | 5927 | 72.49% | 2012 | 2024 |
2.2.21 | CSO entry and exit | V-Dem | v2cseeorgs | 0 | 0.00% | 1975 | 2024 |
2.2.22 | CSO repression | V-Dem | v2csreprss | 0 | 0.00% | 1975 | 2024 |
2.2.23 | Freedom of peaceful assembly | V-Dem | v2caassemb | 24 | 0.29% | 1975 | 2024 |
2.2.24 | Freedom of association and assembly | CLD | freass | 38 | 0.46% | 1975 | 2024 |
2.2.28 | E1 Associational and Organizational Rights | Freedom in the World | E1 | 5927 | 72.49% | 2012 | 2024 |
2.2.29 | E2 Associational and Organizational Rights | Freedom in the World | E2 | 5927 | 72.49% | 2012 | 2024 |
2.2.30 | E3 Associational and Organizational Rights | Freedom in the World | E3 | 5927 | 72.49% | 2012 | 2024 |
2.2.31 | Association/assembly rights | BTI | assembly | 5580 | 68.25% | 2006 | 2024 |
2.2.32 | Freedom of religion | V-Dem | v2clrelig | 0 | 0.00% | 1975 | 2024 |
2.2.33 | Religious organization repression | V-Dem | v2csrlgrep | 0 | 0.00% | 1975 | 2024 |
2.2.34 | Freedom of thought, conscience and religion | CLD | frerel | 38 | 0.46% | 1975 | 2024 |
2.2.36 | D2 Freedom of Expression and Belief | Freedom in the World | D2 | 5927 | 72.49% | 2012 | 2024 |
2.2.41 | Freedom of foreign movement | V-Dem | v2clfmove | 0 | 0.00% | 1975 | 2024 |
2.2.42 | Freedom of domestic movement for women | V-Dem | v2cldmovew | 0 | 0.00% | 1975 | 2024 |
2.2.43 | Freedom of domestic movement for men | V-Dem | v2cldmovem | 0 | 0.00% | 1975 | 2024 |
2.2.44 | Freedom of movement and residence | CLD | fremov | 38 | 0.46% | 1975 | 2024 |
2.2.47 | G1 Personal Autonomy and Individual Rights | Freedom in the World | G1 | 5927 | 72.49% | 2012 | 2024 |
2.3.1 | Infant mortality rate | CME | — | 125 | 1.53% | 1975 | 2024 |
2.3.2 | Life expectancy | WPP | — | 68 | 0.83% | 1975 | 2024 |
2.3.3 | Kilocalories per person per day | FAO | — | 687 | 8.40% | 1975 | 2024 |
2.3.4 | Mean years of schooling – Male | IHME | — | 33 | 0.40% | 1975 | 2024 |
2.3.5 | Mean years of schooling – Female | IHME | — | 33 | 0.40% | 1975 | 2024 |
2.3.6 | Educational equality | V-Dem | v2peedueq | 0 | 0.00% | 1975 | 2024 |
2.3.7 | Health equality | V-Dem | v2pehealth | 0 | 0.00% | 1975 | 2024 |
2.3.8 | Healthy life expectancy at 60 – Male | WHO | WHOSIS_000007 | 3920 | 47.95% | 2000 | 2019 |
2.3.9 | Healthy life expectancy at 60 -– Female | WHO | WHOSIS_000007 | 3920 | 47.95% | 2000 | 2019 |
2.4.1 | Social group equality in respect for civil liberties | V-Dem | v2clsocgrp | 0 | 0.00% | 1975 | 2024 |
2.4.2 | Power distributed by social group | V-Dem | v2pepwrsoc | 0 | 0.00% | 1975 | 2024 |
2.4.3 | Power distributed by sexual orientation | V-Dem | v2pepwrort | 0 | 0.00% | 1975 | 2024 |
2.4.4 | Exclusion by political group index | V-Dem | v2xpe_exlpol | 43 | 0.53% | 1975 | 2024 |
2.4.5 | Exclusion by social group index | V-Dem | v2xpe_exlsocgr | 38 | 0.46% | 1975 | 2024 |
2.4.6 | Political Pluralism and Participation (B4) | Freedom in the World | B4 | 5927 | 72.49% | 2012 | 2024 |
2.4.7 | Rule of Law (F4) | Freedom in the World | F4 | 5927 | 72.49% | 2012 | 2024 |
2.4.8 | Equal opportunity | BTI | equal | 5580 | 68.25% | 2006 | 2024 |
2.4.9 | Social class equality in respect for civil liberties | V-Dem | v2clacjust | 0 | 0.00% | 1975 | 2024 |
2.4.10 | Power distributed by socio-economic position | V-Dem | v2pepwrses | 0 | 0.00% | 1975 | 2024 |
2.4.11 | Exclusion by socio-economic group | V-Dem | v2xpe_exlecon | 23 | 0.28% | 1975 | 2024 |
2.4.12 | Exclusion by urban–rural location index | V-Dem | v2xpe_exlgeo | 38 | 0.46% | 1975 | 2024 |
2.4.13 | Socio-economic barriers | BTI | barriers | 5580 | 68.25% | 2006 | 2024 |
2.4.14 | Gini coefficient | SWIID | gini_disp | 1863 | 22.79% | 1975 | 2024 |
2.4.15 | Power distributed by gender | V-Dem | v2pepwrgen | 0 | 0.00% | 1975 | 2024 |
2.4.16 | CSO women’s participation | V-Dem | v2csgender | 0 | 0.00% | 1975 | 2024 |
2.4.17 | Female vs. male mean years of schooling | GHDx | — | 33 | 0.40% | 1975 | 2024 |
2.4.18 | Lower chamber female legislators | V-Dem | v2lgfemleg | 683 | 8.35% | 1975 | 2024 |
2.4.19 | Exclusion by gender | V-Dem | v2xpe_exlgender | 23 | 0.28% | 1975 | 2024 |
2.4.22 | Political empowerment | Global Gender Gap Report | — | 5962 | 72.92% | 2006 | 2024 |
2.4.23 | Labour force participation rate (women - men) | ILO | EAP_DWAP_SEX_AGE_RT | 2087 | 25.53% | 1975 | 2024 |
2.4.24 | Share of managerial positions held by women | ILO | SDG_T552_NOC_RT | 5190 | 63.48% | 2000 | 2024 |
2.4.25 | Control of bank accounts (women - men) | World Bank | FX.OWN.TOTL.FE.ZS, FX.OWN.TOTL.MA.ZS | 6037 | 73.84% | 2011 | 2024 |
3.1.1 | High Court independence | V-Dem | v2juhcind | 27 | 0.33% | 1975 | 2024 |
3.1.2 | Lower court independence | V-Dem | v2juncind | 0 | 0.00% | 1975 | 2024 |
3.1.3 | Compliance with High Court | V-Dem | v2juhccomp | 30 | 0.37% | 1975 | 2024 |
3.1.4 | Compliance with judiciary | V-Dem | v2jucomp | 30 | 0.37% | 1975 | 2024 |
3.1.6 | F1 Rule of Law | Freedom in the World | F1 | 5927 | 72.49% | 2012 | 2024 |
3.1.7 | Separation of power | BTI | separation | 5580 | 68.25% | 2006 | 2024 |
3.1.8 | Independent judiciary | BTI | judiciary | 5580 | 68.25% | 2006 | 2024 |
3.2.1 | Public sector corrupt exchanges | V-Dem | v2excrptps | 0 | 0.00% | 1975 | 2024 |
3.2.2 | Public sector theft | V-Dem | v2exthftps | 0 | 0.00% | 1975 | 2024 |
3.2.3 | Executive embezzlement and theft | V-Dem | v2exembez | 0 | 0.00% | 1975 | 2024 |
3.2.4 | Executive bribery and corrupt exchanges | V-Dem | v2exbribe | 0 | 0.00% | 1975 | 2024 |
3.2.5 | Corruption | ICRG | F | 2758 | 33.73% | 1984 | 2024 |
3.2.6 | C2 Functioning of Government | Freedom in the World | C2 | 5927 | 72.49% | 2012 | 2024 |
3.2.7 | Prosecution of office abuse | BTI | prosecution | 5580 | 68.25% | 2006 | 2024 |
3.3.1 | Executive respects constitution | V-Dem | v2exrescon | 0 | 0.00% | 1975 | 2024 |
3.3.2 | Transparent laws with predictable enforcement | V-Dem | v2cltrnslw | 0 | 0.00% | 1975 | 2024 |
3.3.3 | Rigorous and impartial public administration | V-Dem | v2clrspct | 0 | 0.00% | 1975 | 2024 |
3.3.4 | Criteria for appointment decisions in the state administration | V-Dem | v2stcritrecadm | 240 | 2.94% | 1975 | 2024 |
3.3.5 | Criteria for appointment decisions in the armed forces | V-Dem | v2stcritapparm | 256 | 3.13% | 1975 | 2024 |
3.3.6 | Bureaucratic quality | ICRG | L | 2758 | 33.73% | 1984 | 2024 |
3.3.7 | Law and order | ICRG | I | 2758 | 33.73% | 1984 | 2024 |
3.3.8 | C3 Functioning of Government | Freedom in the World | C3 | 5927 | 72.49% | 2012 | 2024 |
3.3.9 | Monopoly on the use of force | BTI | monopoly | 5580 | 68.25% | 2006 | 2024 |
3.3.10 | Basic administration | BTI | admin | 5580 | 68.25% | 2006 | 2024 |
3.4.1 | Freedom from torture | V-Dem | v2cltort | 0 | 0.00% | 1975 | 2024 |
3.4.2 | Freedom from political killings | V-Dem | v2clkill | 0 | 0.00% | 1975 | 2024 |
3.4.3 | Political terror scale | Gibney et al. | PTS_S | 275 | 3.36% | 1976 | 2024 |
3.4.4 | Internal conflict | ICRG | D | 2758 | 33.73% | 1984 | 2024 |
3.4.6 | G4 Personal Autonomy and Individual Rights | Freedom in the World | G4 | 5927 | 72.49% | 2012 | 2024 |
3.4.7 | F3 Rule of Law | Freedom in the World | F3 | 5927 | 72.49% | 2012 | 2024 |
4.1.1 | CSO participatory environment | V-Dem | v2csprtcpt | 0 | 0.00% | 1975 | 2024 |
4.1.2 | Engaged society | V-Dem | v2dlengage | 0 | 0.00% | 1975 | 2024 |
4.1.3 | CSO consultation | V-Dem | V2csnsult | 0 | 0.00% | 1975 | 2024 |
4.1.4 | E-Participation index | UN E-Government Survey | — | 4447 | 54.39% | 2003 | 2022 |
4.1.5 | Interest groups | BTI | int_group | 5580 | 68.25% | 2006 | 2024 |
4.1.6 | Social capital | BTI | soc_cap | 5580 | 68.25% | 2006 | 2024 |
4.2.1 | Engagement in independent non-political associations | V-Dem | v2canonpol | 49 | 0.60% | 1975 | 2024 |
4.2.2 | Engagement in independent political associations | V-Dem | v2capolit | 61 | 0.75% | 1975 | 2024 |
4.2.3 | Engagement in independent trade unions | V-Dem | v2catrauni | 64 | 0.78% | 1975 | 2024 |
4.2.4 | Civil society traditions | BTI | civil_trad | 5580 | 68.25% | 2006 | 2024 |
4.2.5 | Mobilization for democracy | V-Dem | v2cademmob | 70 | 0.86% | 1975 | 2024 |
4.3.1 | Election: VAP turnout | International IDEA | VAP turnout | 1510 | 18.47% | 1975 | 2024 |
4.3.2 | Electoral regime index | V-Dem | v2x_electreg | 0 | 0.00% | 1975 | 2024 |
0.0.0 | Direct popular vote index | V-Dem | v2xdd_dd | 0 | 0.00% | 1975 | 2024 |
Dimensionality tests
The empirical dimensionality of the indicators selected to capture latent theoretical concepts at all aggregation levels were assessed using Bayesian factor analysis models. For each model, the first 5,000 iterations of the chain were discarded and the next 100,000 iterations selected. Saving each 100th iteration of the chain produced a data set of 1,000 estimates for the parameters of interest in the models. As a general strategy, Bayesian factor analysis models were estimated by asking for a single factor. Two- and in some cases three-factor models were also run but none of these showed a better general fit with regard to capturing the empirical dimensionality in the data than the unidimensional solutions. Moreover, Cronbach’s alpha (CA) was calculated as a measure of scalability. To inform the choices made, the pairwise bivariate correlation coefficients (Pearson’s r) were also calculated for each cluster of indicators. These are presented in Annex F. The tables in this Annex include, for each indicator, the loadings and their corresponding standard error, the uniqueness coefficients and their corresponding standard errors, and the Cronbach’s alpha coefficients computed for the scale with the item deleted.
Factor loadings and Cronbach’s alpha values
Attribute 1: Representation
No. | Component | Loading | Uniqueness | Cronbach’s alpha if item deleted |
|---|---|---|---|---|
1.1 | Credible Elections | 0.975 | 0.049 | 0.936 |
1.3 | Free Political Parties | 0.885 | 0.216 | 0.946 |
1.4 | Elected Government | 0.966 | 0.066 | 0.935 |
1.5 | Effective Parliament | 0.940 | 0.118 | 0.942 |
1.6 | Local Democracy | 0.802 | 0.357 | 0.963 |
Cronbach’s alpha = 0.955 |
1.1. Credible Elections
No. | Component | Loading | Uniqueness | Cronbach’s alpha if item deleted |
|---|---|---|---|---|
1.1.1 | EMB autonomy | 0.965 | 0.069 | 0.929 |
1.1.2 | EMB capacity | 0.895 | 0.199 | 0.935 |
1.1.3 | Election other voting irregularities | 0.928 | 0.138 | 0.933 |
1.1.4 | Election government intimidation | 0.972 | 0.055 | 0.930 |
1.1.5 | Election free and fair | 0.983 | 0.033 | 0.928 |
1.1.6 | Competition | 0.983 | 0.034 | 0.952 |
1.1.7 | A3 Electoral process | 0.981 | 0.038 | 0.942 |
1.1.8 | B2 Political Pluralism and Participation | 0.988 | 0.023 | 0.941 |
1.1.9 | B3 Political Pluralism and Participation | 0.967 | 0.065 | 0.942 |
1.1.10 | Free and fair elections | 0.972 | 0.056 | 0.934 |
| Cronbach’s alpha = 0.943 |
1.3. Free Political Parties
No. | Component | Loading | Uniqueness | Cronbach’s alpha if item deleted |
|---|---|---|---|---|
1.3.1 | Party ban | 0.870 | 0.244 | 0.850 |
1.3.2 | Barriers to parties | 0.950 | 0.097 | 0.833 |
1.3.3 | Opposition parties’ autonomy | 0.947 | 0.103 | 0.838 |
1.3.4 | Elections multiparty | 0.876 | 0.233 | 0.845 |
1.3.5 | Competitiveness of participation | 0.892 | 0.205 | 0.880 |
1.3.6 | Multiparty elections | 0.913 | 0.167 | 0.900 |
1.3.7 | B1 Political Pluralism and Participation | 0.980 | 0.039 | 0.883 |
|
| Cronbach’s alpha = 0.883 |
1.4. Elected Government
No. | Component | Loading | Uniqueness | Cronbach’s alpha if item deleted |
|---|---|---|---|---|
1.4.1 | Elected officials index | 0.791 | 0.375 | 0.945 |
1.4.2 | Competitiveness of executive recruitment | 0.955 | 0.089 | 0.941 |
1.4.3 | Openness of executive recruitment | 0.878 | 0.228 | 0.944 |
1.4.4 | Electoral | 0.979 | 0.042 | 0.922 |
1.4.5 | A1 Electoral Process | 0.995 | 0.011 | 0.910 |
1.4.6 | A2 Electoral Process | 0.992 | 0.015 | 0.910 |
1.4.7 | C1 Functioning of Government | 0.992 | 0.015 | 0.912 |
1.4.8 | Lexical index of electoral democracy | 0.988 | 0.024 | 0.937 |
|
| Cronbach’s alpha = 0.937 |
1.5. Effective Parliament
No. | Component | Loading | Uniqueness | Cronbach’s alpha if item deleted |
|---|---|---|---|---|
1.5.1 | Legislature questions officials in practice | 0.938 | 0.121 | 0.935 |
1.5.2 | Executive oversight | 0.961 | 0.076 | 0.930 |
1.5.3 | Legislature investigates in practice | 0.972 | 0.055 | 0.927 |
1.5.4 | Legislature: opposition parties | 0.964 | 0.071 | 0.929 |
1.5.5 | Executive constraints | 0.942 | 0.112 | 0.965 |
|
| Cronbach’s alpha = 0.951 |
Attribute 2: Rights
No. | Component | Loading | Uniqueness | Cronbach’s alpha if item deleted |
|---|---|---|---|---|
2.1 | Access to Justice | 0.952 | 0.093 | 0.862 |
2.2 | Civil Liberties | 0.867 | 0.248 | 0.901 |
2.3 | Basic Welfare | 0.720 | 0.483 | 0.931 |
2.4 | Political Equality | 0.906 | 0.178 | 0.869 |
|
| Cronbach’s alpha = 0.917 |
2.1. Access to Justice
No. | Component | Loading | Uniqueness | Cronbach’s alpha if item deleted |
|---|---|---|---|---|
2.1.1 | Access to justice for men | 0.983 | 0.034 | 0.819 |
2.1.2 | Access to justice for women | 0.980 | 0.039 | 0.821 |
2.1.3 | Judicial corruption decision | 0.720 | 0.482 | 0.845 |
2.1.4 | Judicial accountability | 0.674 | 0.546 | 0.859 |
2.1.5 | Fair trial | 0.922 | 0.150 | 0.877 |
2.1.6 | F2 Rule of Law | 0.906 | 0.179 | 0.872 |
2.1.7 | Civil Rights | 0.905 | 0.181 | 0.867 |
|
| Cronbach’s alpha = 0.873 |
2.2. Civil Liberties
No. | Component | Loading | Uniqueness | Cronbach’s alpha if item deleted |
|---|---|---|---|---|
2.2.A | Freedom of Expression | 0.960 | 0.078 | 0.954 |
2.2.B | Freedom of the Press | 0.954 | 0.089 | 0.957 |
2.2.C | Freedom of Association and Assembly | 0.980 | 0.040 | 0.951 |
2.2.D | Freedom of Religion | 0.839 | 0.296 | 0.972 |
2.2.E | Freedom of Movement | 0.895 | 0.198 | 0.961 |
|
| Cronbach’s alpha = 0.967 |
2.2.A. Freedom of Expression
No. | Component | Loading | Uniqueness | Cronbach’s alpha if item deleted |
|---|---|---|---|---|
2.2.1 | Freedom of discussion for women | 0.974 | 0.052 | 0.919 |
2.2.2 | Freedom of discussion for men | 0.980 | 0.040 | 0.920 |
2.2.3 | Freedom of academic and cultural expression | 0.928 | 0.139 | 0.919 |
2.2.4 | Freedom of opinion and expression | 0.884 | 0.219 | 0.938 |
2.2.6 | A. Obstacles to access | 0.848 | 0.281 | 0.927 |
2.2.7 | B. Limits on content | 0.931 | 0.134 | 0.920 |
2.2.8 | C. Violations of user rights | 0.919 | 0.155 | 0.920 |
2.2.9 | D3 Freedom of Expression and Belief | 0.941 | 0.114 | 0.936 |
2.2.10 | D4 Freedom of Expression and Belief | 0.926 | 0.142 | 0.936 |
2.2.11 | Freedom of expression | 0.919 | 0.156 | 0.931 |
|
| Cronbach’s alpha = 0.934 |
2.2.B. Freedom of the Press
No. | Component | Loading | Uniqueness | Cronbach’s alpha if item deleted |
|---|---|---|---|---|
2.2.12 | Print/ broadcast censorship effort | 0.951 | 0.096 | 0.945 |
2.2.13 | Harassment of journalists | 0.941 | 0.115 | 0.946 |
2.2.14 | Media self-censorship | 0.939 | 0.119 | 0.946 |
2.2.15 | Critical print/broadcast media | 0.955 | 0.088 | 0.945 |
2.2.16 | Print/broadcast media perspectives | 0.932 | 0.131 | 0.946 |
2.2.17 | Media bias | 0.942 | 0.112 | 0.945 |
2.2.18 | Media corrupt | 0.913 | 0.166 | 0.948 |
2.2.19 | Media freedom INVERTED | 0.922 | 0.150 | 0.966 |
2.2.20 | D1 Freedom of Expression and Belief | 0.948 | 0.101 | 0.963 |
|
| Cronbach’s alpha = 0.956 |
2.2.C. Freedom of Association and Assembly
No. | Component | Loading | Uniqueness | Cronbach’s alpha if item deleted |
|---|---|---|---|---|
2.2.21 | CSO entry and exit | 0.923 | 0.148 | 0.871 |
2.2.22 | CSO repression | 0.943 | 0.111 | 0.867 |
2.2.23 | Freedom of peaceful assembly | 0.931 | 0.134 | 0.869 |
2.2.24 | Freedom of association and assembly | 0.919 | 0.156 | 0.900 |
2.2.28 | E1 Associational and Organizational Rights | 0.965 | 0.070 | 0.894 |
2.2.29 | E2 Associational and Organizational Rights | 0.977 | 0.046 | 0.894 |
2.2.30 | E3 Associational and Organizational Rights | 0.912 | 0.169 | 0.899 |
2.2.31 | Association/assembly rights | 0.952 | 0.094 | 0.882 |
|
| Cronbach’s alpha = 0.900 |
2.2.D. Freedom of Religion
No. | Component | Loading | Uniqueness | Cronbach’s alpha if item deleted |
|---|---|---|---|---|
2.2.32 | Freedom of religion | 0.951 | 0.096 | 0.863 |
2.2.33 | Religious organization repression | 0.902 | 0.187 | 0.882 |
2.2.34 | Freedom of thought, conscience and religion | 0.870 | 0.243 | 0.890 |
2.2.36 | D2 Freedom of Expression and Belief | 0.937 | 0.121 | 0.880 |
|
| Cronbach’s alpha = 0.907 |
2.2.E. Freedom of Movement
No. | Component | Loading | Uniqueness | Cronbach’s alpha if item deleted |
|---|---|---|---|---|
2.2.41 | Freedom of foreign movement | 0.938 | 0.121 | 0.846 |
2.2.42 | Freedom of domestic movement for women | 0.896 | 0.198 | 0.856 |
2.2.43 | Freedom of domestic movement for men | 0.943 | 0.110 | 0.875 |
2.2.44 | Freedom of movement and residence | 0.840 | 0.294 | 0.864 |
2.2.47 | G1 Personal Autonomy and Individual Rights | 0.935 | 0.125 | 0.885 |
|
| Cronbach’s alpha = 0.890 |
2.3. Basic Welfare
No. | Component | Loading | Uniqueness | Cronbach’s alpha if item deleted |
|---|---|---|---|---|
2.3.1 | Infant mortality rate | 0.982 | 0.035 | 0.927 |
2.3.2 | Life expectancy | 0.969 | 0.062 | 0.926 |
2.3.3 | Kilocalories per person per day | 0.836 | 0.300 | 0.952 |
2.3.4 | Mean years of schooling – Male | 0.865 | 0.252 | 0.934 |
2.3.5 | Mean years of schooling – Female | 0.893 | 0.203 | 0.931 |
2.3.6 | Educational equality | 0.734 | 0.462 | 0.936 |
2.3.7 | Health equality | 0.773 | 0.403 | 0.934 |
2.3.8 | Healthy life expectancy at 60 – Male | 0.798 | 0.363 | 0.942 |
2.3.9 | Healthy life expectancy at 60 – Female | 0.903 | 0.185 | 0.933 |
Cronbach’s alpha = 0.942 |
2.4. Political Equality
No. | Component | Loading | Uniqueness | Cronbach’s alpha if item deleted |
|---|---|---|---|---|
2.4.A | Social Group Equality | 0.970 | 0.059 | 0.877 |
2.4.B | Economic Equality | 0.916 | 0.161 | 0.906 |
2.4.C | Gender Equality | 0.854 | 0.270 | 0.940 |
|
| Cronbach’s alpha = 0.937 |
2.4.A. Social Group Equality
No. | Component | Loading | Uniqueness | Cronbach’s alpha if item deleted |
|---|---|---|---|---|
2.4.1 | Social group equality in respect for civil liberties | 0.823 | 0.323 | 0.870 |
2.4.2 | Power distributed by social group | 0.843 | 0.290 | 0.866 |
2.4.3 | Power distributed by sexual orientation | 0.718 | 0.485 | 0.877 |
2.4.4 | Exclusion by political group index | 0.887 | 0.212 | 0.865 |
2.4.5 | Exclusion by social group index | 0.974 | 0.051 | 0.850 |
2.4.6 | Political Pluralism and Participation (B4) | 0.865 | 0.252 | 0.894 |
2.4.7 | Rule of Law (F4) | 0.909 | 0.173 | 0.895 |
2.4.8 | Equal opportunity | 0.828 | 0.315 | 0.894 |
|
| Cronbach’s alpha = 0.892 |
2.4.A. Economic Equality
No. | Component | Loading | Uniqueness | Cronbach’s alpha if item deleted |
|---|---|---|---|---|
2.4.9 | Social class equality in respect for civil liberties | 0.862 | 0.257 | 0.856 |
2.4.10 | Power distributed by socio-economic position | 0.688 | 0.526 | 0.883 |
2.4.11 | Exclusion by socio-economic Group | 0.994 | 0.011 | 0.833 |
2.4.12 | Exclusion by urban–rural location index | 0.928 | 0.138 | 0.848 |
2.4.13 | Socio-economic barriers | 0.791 | 0.375 | 0.902 |
2.4.14 | Gini coefficient | 0.649 | 0.579 | 0.891 |
|
| Cronbach’s alpha = 0.891 |
2.4.B. Gender Equality
No. | Component | Loading | Uniqueness | Cronbach’s alpha if item deleted |
|---|---|---|---|---|
2.4.15 | Power distributed by gender | 0.881 | 0.225 | 0.826 |
2.4.16 | CSO women’s participation | 0.837 | 0.299 | 0.832 |
2.4.17 | Female vs. male mean years of schooling | 0.646 | 0.582 | 0.847 |
2.4.18 | Lower chamber female legislators | 0.612 | 0.626 | 0.845 |
2.4.19 | Exclusion by gender index | 0.923 | 0.149 | 0.824 |
2.4.22 | Political empowerment | 0.661 | 0.563 | 0.854 |
2.4.23 | Labour force participation rate (women - men) | 0.545 | 0.702 | 0.850 |
2.4.24 | Share of managerial positions held by women | 0.498 | 0.752 | 0.861 |
2.4.25 | Control of bank accounts (women - men) | 0.507 | 0.743 | 0.856 |
| Cronbach’s alpha = 0.859 |
Attribute 3: Rule of Law
No. | Component | Loading | Uniqueness | Cronbach’s alpha if item deleted |
|---|---|---|---|---|
3.1 | Judicial Independence | 0.869 | 0.245 | 0.939 |
3.2 | Absence of Corruption | 0.886 | 0.214 | 0.943 |
3.3 | Predictable Enforcement | 0.989 | 0.022 | 0.913 |
3.4 | Personal Integrity and Security | 0.889 | 0.208 | 0.938 |
|
| Cronbach’s alpha = 0.949 |
3.1. Judicial Independence
No. | Component | Loading | Uniqueness | Cronbach’s alpha if item deleted |
|---|---|---|---|---|
3.1.1 | High Court independence | 0.924 | 0.146 | 0.900 |
3.1.2 | Lower court independence | 0.927 | 0.141 | 0.900 |
3.1.3 | Compliance with High Court | 0.912 | 0.169 | 0.901 |
3.1.4 | Compliance with judiciary | 0.930 | 0.135 | 0.899 |
3.1.6 | F1 Rule of Law | 0.938 | 0.119 | 0.929 |
3.1.7 | Separation of power | 0.905 | 0.181 | 0.920 |
3.1.8 | Independent judiciary | 0.921 | 0.153 | 0.922 |
|
| Cronbach’s alpha = 0.924 |
3.2. Absence of Corruption
No. | Component | Loading | Uniqueness | Cronbach’s alpha if item deleted |
|---|---|---|---|---|
3.2.1 | Public sector corrupt exchanges | 0.955 | 0.088 | 0.896 |
3.2.2 | Public sector theft | 0.962 | 0.075 | 0.895 |
3.2.3 | Executive embezzlement and theft | 0.943 | 0.110 | 0.899 |
3.2.4 | Executive bribery and corrupt exchanges | 0.936 | 0.123 | 0.899 |
3.2.5 | Corruption | 0.767 | 0.412 | 0.917 |
3.2.6 | C2 Functioning of Government | 0.912 | 0.168 | 0.934 |
3.2.7 | Prosecution of office abuse | 0.854 | 0.270 | 0.932 |
|
| Cronbach’s alpha = 0.924 |
3.3. Predictable Enforcement
No. | Component | Loading | Uniqueness | Cronbach’s alpha if item deleted |
|---|---|---|---|---|
3.3.1 | Executive respects constitution | 0.874 | 0.236 | 0.900 |
3.3.2 | Transparent laws with predictable enforcement | 0.928 | 0.140 | 0.899 |
3.3.3 | Rigorous and impartial public administration | 0.938 | 0.120 | 0.897 |
3.3.4 | Criteria for appointment decisions in the state administration | 0.823 | 0.323 | 0.903 |
3.3.5 | Criteria for appointment decisions in the armed forces | 0.799 | 0.362 | 0.902 |
3.3.6 | Bureaucratic quality | 0.787 | 0.380 | 0.904 |
3.3.7 | Law and order | 0.692 | 0.521 | 0.913 |
3.3.8 | C3 Functioning of Government | 0.881 | 0.224 | 0.918 |
3.3.9 | Monopoly on the use of force | 0.708 | 0.499 | 0.920 |
3.3.10 | Basic administration | 0.820 | 0.328 | 0.916 |
|
| Cronbach’s alpha = 0.917 |
3.4. Personal integrity and security
No. | Component | Loading | Uniqueness | Cronbach’s alpha if item deleted |
|---|---|---|---|---|
3.4.1 | Freedom from torture | 0.953 | 0.091 | 0.718 |
3.4.2 | Freedom from political killings | 0.950 | 0.097 | 0.712 |
3.4.3 | Political Terror Scale | 0.748 | 0.440 | 0.813 |
3.4.4 | Internal conflict | 0.649 | 0.578 | 0.799 |
3.4.6 | G4 Personal Autonomy and Individual Rights | 0.904 | 0.183 | 0.818 |
3.4.7 | F3 Rule of Law | 0.956 | 0.085 | 0.804 |
|
| Cronbach’s alpha = 0.816 |
Attribute 4: Participation
No. | Component | Loading | Uniqueness | Cronbach’s alpha if item deleted |
|---|---|---|---|---|
4.1 | Civil Society | 0.929 | 0.136 | 0.412 |
4.2 | Civic Engagement | 0.835 | 0.302 | 0.542 |
4.3 | Electoral Participation | 0.472 | 0.777 | 0.853 |
|
| Cronbach’s alpha = 0.717 |
4.1. Civil Society
No. | Component | Loading | Uniqueness | Cronbach’s alpha if item deleted |
|---|---|---|---|---|
4.1.1 | CSO participatory environment | 0.880 | 0.226 | 0.746 |
4.1.2 | Engaged society | 0.898 | 0.193 | 0.723 |
4.1.3 | CSO consultation | 0.902 | 0.186 | 0.730 |
4.1.4 | EPI—E-participation Index | 0.441 | 0.805 | 0.856 |
4.1.5 | Interest groups | 0.883 | 0.221 | 0.803 |
4.1.6 | Social capital | 0.862 | 0.256 | 0.812 |
|
| Cronbach’s alpha = 0.815 |
4.2. Civic Engagement
No. | Component | Loading | Uniqueness | Cronbach’s alpha if item deleted |
|---|---|---|---|---|
4.2.1 | Engagement in independent non-political associations | 0.767 | 0.411 | 0.676 |
4.2.2 | Engagement in independent political associations | 0.891 | 0.207 | 0.596 |
4.2.3 | Engagement in independent trade unions | 0.821 | 0.326 | 0.638 |
4.2.4 | Civil society traditions | 0.661 | 0.563 | 0.750 |
4.2.5 | Mobilization for democracy | 0.386 | 0.851 | 0.792 |
Cronbach’s alpha = 0.746 |
The tables in this Annex present the pairwise bivariate correlation coefficients (Pearson’s r) for each of the clusters of indicators that were subsequently aggregated into subcomponents, subattributes or attributes. While the cells above the diagonal list the coefficients, the cells below the diagonal contain the respective numbers of observations (country–years).
Attribute 1. Representation
No. | Component | 1.1 | 1.2 | 1.3 | 1.4 | 1.5 | 1.6 |
|---|---|---|---|---|---|---|---|
1.1 | Credible Elections | — | 0.778 | 0.843 | 0.940 | 0.931 | 0.780 |
1.2 | Inclusive Suffrage | 8175 | — | 0.587 | 0.774 | 0.774 | 0.490 |
1.3 | Free Political Parties | 8176 | 8175 | — | 0.887 | 0.803 | 0.784 |
1.4 | Elected Government | 8176 | 8175 | 8176 | — | 0.898 | 0.769 |
1.5 | Effective Parliament | 8176 | 8175 | 8176 | 8176 | — | 0.735 |
1.6 | Local Democracy | 8139 | 8138 | 8139 | 8139 | 8139 | — |
1.1. Credible Elections
No. | Component | 1.1.1 | 1.1.2 | 1.1.3 | 1.1.4 | 1.1.5 | 1.1.6 | 1.1.7 | 1.1.8 | 1.1.9 | 1.1.10 |
|---|---|---|---|---|---|---|---|---|---|---|---|
1.1.1 | EMB autonomy | — | 0.800 | 0.801 | 0.894 | 0.927 | 0.826 | 0.940 | 0.929 | 0.915 | 0.932 |
1.1.2 | EMB capacity | 8176 | — | 0.815 | 0.781 | 0.796 | 0.637 | 0.838 | 0.815 | 0.825 | 0.811 |
1.1.3 | Election other voting irregularities | 8083 | 8083 | — | 0.837 | 0.859 | 0.673 | 0.878 | 0.865 | 0.878 | 0.830 |
1.1.4 | Election government intimidation | 8083 | 8083 | 8083 | — | 0.946 | 0.797 | 0.919 | 0.915 | 0.915 | 0.900 |
1.1.5 | Election free and fair | 8064 | 8064 | 8064 | 8064 | — | 0.822 | 0.928 | 0.920 | 0.916 | 0.912 |
1.1.6 | Competition | 8175 | 8175 | 8082 | 8082 | 8063 | — | 0.894 | 0.913 | 0.853 | 0.835 |
1.1.7 | A3 Electoral process | 3068 | 3068 | 3068 | 3068 | 3068 | 3068 | — | 0.947 | 0.936 | 0.936 |
1.1.8 | B2 Political Pluralism and Participation | 3068 | 3068 | 3068 | 3068 | 3068 | 3068 | 3068 | — | 0.929 | 0.923 |
1.1.9 | B3 Political Pluralism and Participation | 3068 | 3068 | 3068 | 3068 | 3068 | 3068 | 3068 | 3068 | — | 0.915 |
1.1.10 | Free and fair elections | 3370 | 3370 | 3369 | 3369 | 3369 | 3370 | 2561 | 2561 | 2561 | — |
1.3. Free Political Parties
No. | Component | 1.3.1 | 1.3.2 | 1.3.3 | 1.3.4 | 1.3.5 | 1.3.6 | 1.3.7 |
|---|---|---|---|---|---|---|---|---|
1.3.1 | Party ban | — | 0.781 | 0.746 | 0.726 | 0.703 | 0.692 | 0.707 |
1.3.2 | Barriers to parties | 8176 | — | 0.876 | 0.805 | 0.794 | 0.691 | 0.841 |
1.3.3 | Opposition parties’ autonomy | 7980 | 7980 | — | 0.794 | 0.813 | 0.668 | 0.859 |
1.3.4 | Elections multiparty | 8083 | 8083 | 7887 | — | 0.780 | 0.750 | 0.836 |
1.3.5 | Competitiveness of participation | 7580 | 7580 | 7414 | 7488 | — | 0.682 | 0.796 |
1.3.6 | Multiparty elections | 8175 | 8175 | 7979 | 8082 | 7579 | — | 0.608 |
1.3.7 | B1 Political Pluralism and Participation | 2249 | 2249 | 2219 | 2249 | 2107 | 2249 | — |
1.4. Elected Government
No. | Component | 1.4.1 | 1.4.2 | 1.4.3 | 1.4.4 | 1.4.5 | 1.4.6 | 1.4.7 | 1.4.8 |
|---|---|---|---|---|---|---|---|---|---|
1.4.1 | Elected officials index | — | 0.559 | 0.679 | 0.745 | 0.735 | 0.750 | 0.726 | 0.683 |
1.4.2 | Competitiveness of executive recruitment | 7756 | — | 0.612 | 0.781 | 0.917 | 0.911 | 0.898 | 0.886 |
1.4.3 | Openness of executive recruitment | 7756 | 7756 | — | 0.691 | 0.749 | 0.756 | 0.733 | 0.649 |
1.4.4 | Electoral | 8172 | 7752 | 7752 | — | 0.845 | 0.871 | 0.837 | 0.880 |
1.4.5 | A1 Electoral Process | 3068 | 2973 | 2973 | 3065 | — | 0.962 | 0.961 | 0.932 |
1.4.6 | A2 Electoral Process | 3068 | 2973 | 2973 | 3065 | 3068 | — | 0.956 | 0.946 |
1.4.7 | C1 Functioning of Government | 3068 | 2973 | 2973 | 3065 | 3068 | 3068 | — | 0.921 |
1.4.8 | Lexical index of electoral democracy | 8174 | 7755 | 7755 | 8171 | 3068 | 3068 | 3068 | — |
1.5. Effective Parliament
No. | Component | 1.5.1 | 1.5.2 | 1.5.3 | 1.5.4 | 1.5.5 |
|---|---|---|---|---|---|---|
1.5.1 | Legislature questions officials in practice | — | 0.849 | 0.867 | 0.857 | 0.819 |
1.5.2 | Executive oversight | 8176 | — | 0.906 | 0.876 | 0.824 |
1.5.3 | Legislature investigates in practice | 8176 | 8176 | — | 0.895 | 0.845 |
1.5.4 | Legislature opposition parties | 8176 | 8176 | 8176 | — | 0.874 |
1.5.5 | Executive constraints | 7777 | 7777 | 7777 | 7777 | — |
1.6. Local Democracy
No. | Component | 1.6.1 | 1.6.2 |
|---|---|---|---|
1.6.1 | Local government index | — | 0.637 |
1.6.2 | Subnational elections free and fair | 7987 | — |
Attribute 2. Rights
No. | Component | 2.1 | 2.2 | 2.3 | 2.4 |
|---|---|---|---|---|---|
2.1 | Access to Justice | — | 0.843 | 0.670 | 0.855 |
2.2 | Civil Liberties | 8176 | — | 0.549 | 0.773 |
2.3 | Basic Welfare | 8176 | 8176 | — | 0.734 |
2.4 | Political Equality | 8176 | 8176 | 8176 | — |
2.1. Access to Justice
No. | Component | 2.1.1 | 2.1.2 | 2.1.3 | 2.1.4 | 2.1.5 | 2.1.6 | 2.1.7 |
|---|---|---|---|---|---|---|---|---|
2.1.1 | Access to justice for men | — | 0.952 | 0.660 | 0.611 | 0.833 | 0.814 | 0.787 |
2.1.2 | Access to justice for women | 8176 | — | 0.646 | 0.609 | 0.835 | 0.815 | 0.783 |
2.1.3 | Judicial corruption decision | 8146 | 8146 | — | 0.640 | 0.716 | 0.739 | 0.578 |
2.1.4 | Judicial accountability | 8176 | 8176 | 8146 | — | 0.607 | 0.586 | 0.363 |
2.1.5 | Fair trial | 8138 | 8138 | 8108 | 8138 | — | 0.862 | 0.789 |
2.1.6 | F2 Rule of Law | 2249 | 2249 | 2249 | 2249 | 2249 | — | 0.826 |
2.1.7 | Civil rights | 2596 | 2596 | 2596 | 2596 | 2596 | 1724 | — |
2.2. Civil Liberties
No. | Component | 2.2.A | 2.2.B | 2.2.C | 2.2.D | 2.2.E |
|---|---|---|---|---|---|---|
2.2.A | Freedom of Expression | — | 0.924 | 0.938 | 0.792 | 0.868 |
2.2.B | Freedom of the Press | 8176 | — | 0.938 | 0.784 | 0.828 |
2.2.C | Freedom of Association and Assembly | 8176 | 8176 | — | 0.825 | 0.877 |
2.2.D | Freedom of Religion | 8176 | 8176 | 8176 | — | 0.815 |
2.2.E | Freedom of Movement | 8176 | 8176 | 8176 | 8176 | — |
2.2.A. Freedom of Expression
No. | Component | 2.2.1 | 2.2.2 | 2.2.3 | 2.2.4 | 2.2.6 | 2.2.7 | 2.2.8 | 2.2.9 | 2.2.10 | 2.2.11 |
|---|---|---|---|---|---|---|---|---|---|---|---|
2.2.1 | Freedom of discussion for women | — | 0.959 | 0.891 | 0.798 | 0.766 | 0.832 | 0.830 | 0.832 | 0.825 | 0.816 |
2.2.2 | Freedom of discussion for men | 8176 | — | 0.895 | 0.809 | 0.749 | 0.837 | 0.825 | 0.833 | 0.829 | 0.824 |
2.2.3 | Freedom of academic and cultural expression | 8176 | 8176 | — | 0.794 | 0.745 | 0.852 | 0.837 | 0.841 | 0.798 | 0.819 |
2.2.4 | Freedom of opinion and expression | 8138 | 8138 | 8138 | — | 0.754 | 0.834 | 0.820 | 0.806 | 0.783 | 0.802 |
2.2.6 | A. Obstacles to access | 881 | 881 | 881 | 881 | — | 0.756 | 0.751 | 0.730 | 0.712 | 0.616 |
2.2.7 | B. Limits on content | 881 | 881 | 881 | 881 | 881 | — | 0.912 | 0.865 | 0.823 | 0.831 |
2.2.8 | C. Violations of user rights | 881 | 881 | 881 | 881 | 881 | 881 | — | 0.853 | 0.807 | 0.826 |
2.2.9 | D3 Freedom of Expression and Belief | 2249 | 2249 | 2249 | 2249 | 844 | 844 | 844 | — | 0.883 | 0.844 |
2.2.10 | D4 Freedom of Expression and Belief | 2249 | 2249 | 2249 | 2249 | 844 | 844 | 844 | 2249 | — | 0.831 |
2.2.11 | Freedom of expression | 2596 | 2596 | 2596 | 2596 | 758 | 758 | 758 | 1724 | 1724 | — |
2.2.B. Freedom of the Press
No. | Component | 2.2.12 | 2.2.13 | 2.2.14 | 2.2.15 | 2.2.16 | 2.2.17 | 2.2.18 | 2.2.19 | 2.2.20 |
|---|---|---|---|---|---|---|---|---|---|---|
2.2.12 | Print/broadcast censorship effort | — | 0.890 | 0.884 | 0.890 | 0.864 | 0.888 | 0.840 | 0.796 | 0.847 |
2.2.13 | Harassment of journalists | 8176 | — | 0.863 | 0.862 | 0.855 | 0.862 | 0.847 | 0.797 | 0.860 |
2.2.14 | Media self-censorship | 8176 | 8176 | — | 0.879 | 0.854 | 0.865 | 0.818 | 0.746 | 0.795 |
2.2.15 | Critical print/broadcast media | 8176 | 8176 | 8176 | — | 0.880 | 0.893 | 0.829 | 0.764 | 0.794 |
2.2.16 | Print/broadcast media perspectives | 8176 | 8176 | 8176 | 8176 | — | 0.889 | 0.808 | 0.731 | 0.773 |
2.2.17 | Media bias | 8176 | 8176 | 8176 | 8176 | 8176 | — | 0.834 | 0.758 | 0.768 |
2.2.18 | Media corrupt | 8176 | 8176 | 8176 | 8176 | 8176 | 8176 | — | 0.764 | 0.814 |
2.2.19 | Media freedom INVERTED | 7783 | 7783 | 7783 | 7783 | 7783 | 7783 | 7783 | — | 0.893 |
2.2.20 | D1 Freedom of Expression and Belief | 2249 | 2249 | 2249 | 2249 | 2249 | 2249 | 2249 | 2145 | — |
2.2.C. Freedom of Association and Assembly
No. | Component | 2.2.21 | 2.2.22 | 2.2.23 | 2.2.24 | 2.2.28 | 2.2.29 | 2.2.30 | 2.2.31 |
|---|---|---|---|---|---|---|---|---|---|
2.2.21 | CSO entry and exit | — | 0.889 | 0.844 | 0.831 | 0.794 | 0.828 | 0.726 | 0.802 |
2.2.22 | CSO repression | 8176 | — | 0.883 | 0.816 | 0.838 | 0.864 | 0.774 | 0.833 |
2.2.23 | Freedom of peaceful assembly | 8152 | 8152 | — | 0.826 | 0.874 | 0.840 | 0.791 | 0.832 |
2.2.24 | Freedom of association and assembly | 8138 | 8138 | 8114 | — | 0.844 | 0.854 | 0.768 | 0.805 |
2.2.28 | E1 Associational and Organizational Rights | 2249 | 2249 | 2248 | 2249 | — | 0.906 | 0.837 | 0.861 |
2.2.29 | E2 Associational and Organizational Rights | 2249 | 2249 | 2248 | 2249 | 2249 | — | 0.853 | 0.879 |
2.2.30 | E3 Associational and Organizational Rights | 2249 | 2249 | 2248 | 2249 | 2249 | 2249 | — | 0.786 |
2.2.31 | Association/assembly rights | 2596 | 2596 | 2596 | 2596 | 1724 | 1724 | 1724 | — |
2.2.D. Freedom of Religion
No. | Component | 2.2.32 | 2.2.33 | 2.2.34 | 2.2.36 |
|---|---|---|---|---|---|
2.2.32 | Freedom of religion | — | 0.776 | 0.717 | 0.787 |
2.2.33 | Religious organization repression | 8176 | — | 0.680 | 0.718 |
2.2.34 | Freedom of thought, conscience and religion | 8138 | 8138 | — | 0.774 |
2.2.36 | D2 Freedom of Expression and Belief | 2249 | 2249 | 2249 | — |
2.2.E. Freedom of Movement
No. | Component | 2.2.41 | 2.2.42 | 2.2.43 | 2.2.44 | 2.2.47 |
|---|---|---|---|---|---|---|
2.2.41 | Freedom of foreign movement | — | 0.718 | 0.729 | 0.676 | 0.696 |
2.2.42 | Freedom of domestic movement for women | 8176 | — | 0.715 | 0.583 | 0.681 |
2.2.43 | Freedom of domestic movement for men | 8176 | 8176 | — | 0.572 | 0.524 |
2.2.44 | Freedom of movement and residence | 8138 | 8138 | 8138 | — | 0.707 |
2.2.47 | G1 Personal Autonomy and Individual Rights | 2249 | 2249 | 2249 | 2249 | — |
2.3. Basic Welfare
No. | Component | 2.3.1 | 2.3.2 | 2.3.3 | 2.3.4 | 2.3.5 | 2.3.6 | 2.3.7 | 2.3.9 | 2.3.9 |
|---|---|---|---|---|---|---|---|---|---|---|
2.3.1 | Infant mortality rate | — | 0.953 | 0.668 | 0.837 | 0.876 | 0.715 | 0.751 | 0.682 | 0.832 |
2.3.2 | Life expectancy | 8049 | — | 0.668 | 0.782 | 0.819 | 0.676 | 0.727 | 0.815 | 0.883 |
2.3.3 | Kilocalories per person per day | 7394 | 7439 | — | 0.589 | 0.604 | 0.471 | 0.523 | 0.469 | 0.559 |
2.3.4 | Average years of schooling – Male | 8034 | 8091 | 7489 | — | 0.974 | 0.670 | 0.656 | 0.463 | 0.629 |
2.3.5 | Average years of schooling– Female | 8034 | 8091 | 7489 | 8143 | — | 0.686 | 0.685 | 0.495 | 0.677 |
2.3.6 | Educational equality | 8051 | 8108 | 7489 | 8143 | 8143 | — | 0.902 | 0.443 | 0.602 |
2.3.7 | Health equality | 8051 | 8108 | 7489 | 8143 | 8143 | 8176 | — | 0.537 | 0.685 |
2.3.8 | Healthy life expectancy at 60 – Male | 4256 | 4256 | 4021 | 4256 | 4256 | 4256 | 4256 | — | 0.885 |
2.3.9 | Healthy life expectancy at 60 – Female | 4256 | 4256 | 4021 | 4256 | 4256 | 4256 | 4256 | 4256 | — |
2.4. Political Equality
No. | Component | 2.4.A | 2.4.B | 2.4.C |
|---|---|---|---|---|
2.4.A | Social Group Equality | — | 0.889 | 0.829 |
2.4.B | Economic Equality | 8176 | — | 0.783 |
2.4.C | Gender Equality | 8176 | 8176 | — |
2.4.A. Social Group Equality
No. | Component | 2.4.1 | 2.4.2 | 2.4.3 | 2.4.4 | 2.4.5 | 2.4.6 | 2.4.7 | 2.4.8 |
|---|---|---|---|---|---|---|---|---|---|
2.4.1 | Social group equality in respect for civil liberties | — | 0.731 | 0.555 | 0.616 | 0.780 | 0.653 | 0.675 | 0.480 |
2.4.2 | Power distributed by social group | 8176 | — | 0.581 | 0.680 | 0.809 | 0.727 | 0.707 | 0.401 |
2.4.3 | Power distributed by sexual orientation | 8176 | 8176 | — | 0.614 | 0.683 | 0.678 | 0.700 | 0.549 |
2.4.4 | Exclusion by political group index | 8133 | 8133 | 8133 | — | 0.843 | 0.697 | 0.746 | 0.628 |
2.4.5 | Exclusion by social group index | 8138 | 8138 | 8138 | 8133 | — | 0.724 | 0.780 | 0.695 |
2.4.6 | Political Pluralism and Participation (B4) | 2249 | 2249 | 2249 | 2242 | 2242 | — | 0.848 | 0.596 |
2.4.7 | Rule of Law (F4) | 2249 | 2249 | 2249 | 2242 | 2242 | 2249 | — | 0.665 |
2.4.8 | Equal opportunity | 2596 | 2596 | 2596 | 2593 | 2593 | 1724 | 1724 | — |
2.4.B. Economic Equality
No. | Component | 2.4.9 | 2.4.10 | 2.4.11 | 2.4.12 | 2.4.13 | 2.4.14 |
|---|---|---|---|---|---|---|---|
2.4.9 | Social class equality in respect for civil liberties | — | 0.678 | 0.818 | 0.724 | 0.429 | 0.539 |
2.4.10 | Power distributed by socio-economic position | 8176 | — | 0.691 | 0.548 | 0.304 | 0.405 |
2.4.11 | Exclusion by socio-economic group | 8160 | 8160 | — | 0.910 | 0.691 | 0.600 |
2.4.12 | Exclusion by urban–rural location index | 8145 | 8145 | 8145 | — | 0.776 | 0.584 |
2.4.13 | Socio-economic barriers | 2596 | 2596 | 2596 | 2596 | — | 0.429 |
2.4.14 | Gini coefficient | 6313 | 6313 | 6313 | 6313 | 2514 | — |
2.4.C. Gender Equality
No. | Component | 2.4.15 | 2.4.16 | 2.4.17 | 2.4.18 | 2.4.19 | 2.4.22 | 2.4.23 | 2.4.24 | 2.4.25 |
|---|---|---|---|---|---|---|---|---|---|---|
2.4.15 | Power distributed by gender | — | 0.725 | 0.482 | 0.508 | 0.790 | 0.560 | 0.464 | 0.328 | 0.388 |
2.4.16 | CSO women’s participation | 8176 | — | 0.548 | 0.422 | 0.750 | 0.420 | 0.434 | 0.400 | 0.312 |
2.4.17 | Female vs. male mean years of schooling | 8143 | 8143 | — | 0.410 | 0.661 | 0.174 | 0.194 | 0.335 | 0.427 |
2.4.18 | Lower chamber female legislators | 7493 | 7493 | 7466 | — | 0.467 | 0.783 | 0.413 | 0.253 | 0.229 |
2.4.19 | Exclusion by gender index | 8153 | 8153 | 8136 | 7472 | — | 0.409 | 0.421 | 0.388 | 0.490 |
2.4.22 | Political empowerment | 2214 | 2214 | 2214 | 2184 | 2209 | — | 0.303 | 0.199 | 0.247 |
2.4.23 | Labour force participation rate (women - men) | 6089 | 6089 | 6073 | 5730 | 6087 | 2012 | — | 0.420 | 0.433 |
2.4.24 | Share of managerial positions held by women | 2986 | 2986 | 2973 | 2925 | 2984 | 1825 | 2980 | — | 0.276 |
2.4.25 | Control of bank accounts (women - men) | 2139 | 2139 | 2125 | 2087 | 2134 | 1593 | 1840 | 1662 | — |
Attribute 3. Rule of Law
No. | Component | 3.1 | 3.2 | 3.3 | 3.4 |
|---|---|---|---|---|---|
3.1 | Judicial Independence | — | 0.770 | 0.855 | 0.809 |
3.2 | Absence of Corruption | 8176 | — | 0.879 | 0.758 |
3.3 | Predictable Enforcement | 8176 | 8176 | — | 0.880 |
3.4 | Personal Integrity and Security | 8176 | 8176 | 8176 | — |
3.1. Judicial Independence
No. | Component | 3.1.1 | 3.1.2 | 3.1.3 | 3.1.4 | 3.1.6 | 3.1.7 | 3.1.8 |
|---|---|---|---|---|---|---|---|---|
3.1.1 | High Court independence | — | 0.906 | 0.786 | 0.810 | 0.800 | 0.725 | 0.729 |
3.1.2 | Lower court independence | 8149 | — | 0.792 | 0.807 | 0.810 | 0.726 | 0.748 |
3.1.3 | Compliance with High Court | 8146 | 8146 | — | 0.892 | 0.820 | 0.743 | 0.761 |
3.1.4 | Compliance with judiciary | 8146 | 8146 | 8146 | — | 0.827 | 0.742 | 0.773 |
3.1.6 | F1 Rule of Law | 2249 | 2249 | 2249 | 2249 | — | 0.813 | 0.858 |
3.1.7 | Separation of power | 2596 | 2596 | 2596 | 2596 | 1724 | — | 0.897 |
3.1.8 | Independent judiciary | 2596 | 2596 | 2596 | 2596 | 1724 | 2596 | — |
3.2. Absence of Corruption
No. | Component | 3.2.1 | 3.2.2 | 3.2.3 | 3.2.4 | 3.2.5 | 3.2.6 | 3.2.7 |
|---|---|---|---|---|---|---|---|---|
3.2.1 | Public sector corrupt exchanges | — | 0.911 | 0.857 | 0.857 | 0.683 | 0.812 | 0.719 |
3.2.2 | Public sector theft | 8176 | — | 0.870 | 0.847 | 0.688 | 0.814 | 0.704 |
3.2.3 | Executive embezzlement and theft | 8176 | 8176 | — | 0.881 | 0.660 | 0.780 | 0.671 |
3.2.4 | Executive bribery and corrupt exchanges | 8176 | 8176 | 8176 | — | 0.675 | 0.794 | 0.675 |
3.2.5 | Corruption | 5418 | 5418 | 5418 | 5418 | — | 0.806 | 0.653 |
3.2.6 | C2 Functioning of Government | 2249 | 2249 | 2249 | 2249 | 1785 | — | 0.799 |
3.2.7 | Prosecution of office abuse | 2596 | 2596 | 2596 | 2596 | 2118 | 1724 | — |
3.3. Predictable Enforcement
No. | Component | 3.3.1 | 3.3.2 | 3.3.3 | 3.3.4 | 3.3.5 | 3.3.6 | 3.3.7 | 3.3.8 | 3.3.9 | 3.3.10 |
|---|---|---|---|---|---|---|---|---|---|---|---|
3.3.1 | Executive respects constitution | — | 0.800 | 0.790 | 0.673 | 0.706 | 0.661 | 0.525 | 0.762 | 0.362 | 0.541 |
3.3.2 | Transparent laws with predictable enforcement | 8176 | — | 0.860 | 0.679 | 0.666 | 0.636 | 0.510 | 0.775 | 0.398 | 0.508 |
3.3.3 | Rigorous and impartial public administration | 8176 | 8176 | — | 0.665 | 0.668 | 0.660 | 0.587 | 0.757 | 0.484 | 0.607 |
3.3.4 | Criteria for appointment decisions in the state administration | 7936 | 7936 | 7936 | — | 0.777 | 0.650 | 0.473 | 0.698 | 0.376 | 0.539 |
3.3.5 | Criteria for appointment decisions in the armed forces | 7920 | 7920 | 7920 | 7920 | — | 0.625 | 0.470 | 0.741 | 0.383 | 0.591 |
3.3.6 | Bureaucratic quality | 5418 | 5418 | 5418 | 5258 | 5252 | — | 0.665 | 0.599 | 0.521 | 0.668 |
3.3.7 | Law and order | 5418 | 5418 | 5418 | 5258 | 5252 | 5418 | — | 0.434 | 0.556 | 0.549 |
3.3.8 | C3 Functioning of Government | 2249 | 2249 | 2249 | 2249 | 2249 | 1785 | 1785 | — | 0.356 | 0.517 |
3.3.9 | Monopoly on the use of force | 2596 | 2596 | 2596 | 2596 | 2596 | 2118 | 2118 | 1724 | — | 0.770 |
3.3.10 | Basic administration | 2596 | 2596 | 2596 | 2596 | 2596 | 2118 | 2118 | 1724 | 2596 | — |
3.4. Personal Integrity and Security
No. | Component | 3.4.1 | 3.4.2 | 3.4.3 | 3.4.4 | 3.4.6 | 3.4.7 |
|---|---|---|---|---|---|---|---|
3.4.1 | Freedom from torture | — | 0.901 | 0.640 | 0.551 | 0.791 | 0.858 |
3.4.2 | Freedom from political killings | 8176 | — | 0.666 | 0.588 | 0.742 | 0.832 |
3.4.3 | Political Terror Scale | 7901 | 7901 | — | 0.612 | 0.671 | 0.797 |
3.4.4 | Internal conflict | 5418 | 5418 | 5390 | — | 0.599 | 0.648 |
3.4.6 | G4 Personal Autonomy and Individual Rights | 2249 | 2249 | 2249 | 1785 | — | 0.814 |
3.4.7 | F3 Rule of Law | 2249 | 2249 | 2249 | 1785 | 2249 | — |
Attribute 4. Participation
No. | Component | 4.1 | 4.2 | 4.3 |
|---|---|---|---|---|
4.1 | Civil Society | — | 0.757 | 0.455 |
4.2 | Civic Engagement | 8127 | — | 0.377 |
4.3 | Electoral Participation | 7333 | 7284 | — |
4.1. Civil Society
No. | Component | 4.1.1 | 4.1.2 | 4.1.3 | 4.1.4 | 4.1.5 | 4.1.6 |
|---|---|---|---|---|---|---|---|
4.1.1 | CSO participatory environment | — | 0.754 | 0.792 | 0.225 | 0.574 | 0.529 |
4.1.2 | Engaged society | 8176 | — | 0.814 | 0.327 | 0.662 | 0.624 |
4.1.3 | CSO consultation | 8176 | 8176 | — | 0.280 | 0.593 | 0.572 |
4.1.4 | EPI—E-participation Index | 3729 | 3729 | 3729 | — | 0.329 | 0.329 |
4.1.5 | Interest groups | 2596 | 2596 | 2596 | 2560 | — | 0.842 |
4.1.6 | Social capital | 2596 | 2596 | 2596 | 2560 | 2596 | — |
4.2. Civic Engagement
No. | Component | 4.2.1 | 4.2.2 | 4.2.3 | 4.2.4 | 4.2.5 |
|---|---|---|---|---|---|---|
4.2.1 | Engagement in independent non-political associations | — | 0.624 | 0.591 | 0.281 | 0.137 |
4.2.2 | Engagement in independent political associations | 8115 | — | 0.665 | 0.519 | 0.333 |
4.2.3 | Engagement in independent trade unions | 8112 | 8112 | — | 0.436 | 0.221 |
4.2.4 | Civil society traditions | 2596 | 2596 | 2596 | — | 0.218 |
4.2.5 | Mobilization for democracy | 8106 | 8106 | 8106 | 2596 | — |
Version 4 of the Technical Procedures Guide (Tufis 2020) contains extensive tables that show the relationships between aspects of the GSoD Indices and data sets from other sources. We have not updated those tables for Version 9.
International IDEA would like to thank everyone who has been involved in the production of the Global State of Democracy Indices. The Indices have benefited from the contributions of many individuals at International IDEA, and from the expert input of members of the Institute’s partner organizations. In particular, thanks to Lina Antara, Martin Brussis, Thijs Heinmaa, Alexander Hudson, Mélida Jiménez, Joseph Noonan, Miguel Angel Lara Otaola, Victoria Perotti, Svend-Erik Skaaning and Claudiu D. Tufis for their contributions to the development of the Global State of Democracy Indices, and to the members of the Expert Advisory Board for their review of the methodology and related documentation.
Methodology and data set development (Global State of Democracy Indices)
Svend-Erik Skaaning, Professor at the Department of Political Science at Aarhus University, Project Manager, the Varieties of Democracy (V-Dem) Project
Claudiu D. Tufis, Associate Professor, University of Bucharest, Political Science Department
Expert Advisory Board (Global State of Democracy Indices)
Michael Bernhard, Raymond and Miriam Ehrlich Chair, Professor at the Department of Political Science at the University of Florida
Michael Coppedge, Professor at the Department of Political Science and Faculty Fellow at the Kellogg Institute of International Studies at the University of Notre Dame, Co-Principal Investigator of the Varieties of Democracy (V-Dem) Project
Carl-Henrik Knutsen, Professor at the Department of Political Science at the University of Oslo, Co-Principal Investigator of the Historical Varieties of Democracy (V-Dem) Project
Staffan Lindberg, Professor at the Department of Political Science at the University of Gothenburg, Director of the Varieties of Democracy (V-Dem) Institute
Gerardo Munck, Professor at the School of International Relations at the University of Southern California
© 2025 International Institute for Democracy and Electoral Assistance
International IDEA publications are independent of specific national or political interests. Views expressed in this publication do not necessarily represent the views of International IDEA, its Board or its Council members.
International IDEA encourages dissemination of its work and will promptly respond to requests for permission to reproduce or translate this publication.
Design and layout: International IDEA
DOI: <https://doi.org/10.31752/idea.2025.31>
ISBN: 978-91-7671-953-4 (HTML)
ISBN: 978-91-7671-952-7 (PDF)